HAPPY NEW YEAR ALL!
THANK YOU FOR FOLLOWING.
Monday, December 31, 2012
Thursday, December 27, 2012
Time to be careful!!!
President Obama comes back early from holiday and everyone
"hopes" this means a deal is imminent. But the market is a
psychological machine that currently has all this euphoria adding up to
+3handles yesterday morning and -5handles on the day…because of that news? The
early morning strength just didn’t add
up if youre not wearing the christmas-rose colored glasses.
Technically the broad market suffered some real damage last week. Friday 12/21 was the heaviest volume selloff in the SPY since the reversal bottom on 11/16. High volume is typically a sign of a reversal especially after a strong selloff (sep 14th to nov 16th selloff was 8%) or after a strong rally (nov 16th to dec 18th rally was ~8%). My take, looking through monetarily or psychologically unbiased glasses, is that the broad market is in trouble. Anyone in this business for a while knows the "hope" trade never works and reality is what you see...not what you think.
Having said all that on the day after christmas (sorry to be such a scrooge) it is clear to see i am leaning very bearish. The announcement of a fiscal cliff deal, in my view, will be one of the biggest "sell the news" events of the year. On the way down, 1400 will be good psychological support and the first battleground followed by 1370/80 and then the area surrounding the November lows near 1340/50. The only thing that will change that view is a high volume broad market rally over the September highs of 1452.

Thursday, December 20, 2012
Gun makers oversold rally
Since the elementary school massacre in Newtown, CT gun makers (RGR and SWHC) and sellers (CAB and DKS) have been getting smoked. Actually, starting a little before the shootings the stocks were under pressure and then those horrible events accelerated the selling pressure. But when stocks get hit for 30% in a very short period of time there is often a relief rally...and the action yesterday in the names mentioned above are doing just that.
As you know I believe the best way to play a stock is in the
direction of its trend - and these trends are to the downside. So if you want
to play for a countertrend bounce which may reap some nice percentage gains, I
would suggest you be careful and be out on sharp moves. But if you are looking
for a bigger swing trade move and not just a scalp, then look for areas of
overhead resistance (like $9-9.50 SWHC, $45, then $46-47 RGR) to play from the
short side. (CAB and DKS may also fit this scenario but I believe pure gun
makers will be hurt much more than sellers because CAB and DKS have so many
other products in their revenue mix).
Ultimately SWHC may go to $6 and RGR may see $35 or as low
as $30. Stops above according to your risk tolerance.
Tuesday, December 18, 2012
T - looking iffy at these levels.
Like a lot of high dividend paying stocks and closed-end
funds, AT&T is just not acting well these days. Its relative
underperformance to many other stocks and its benchmark has been very
apparent recently as the stock continues to struggle below its 200 day moving
average. Needless to say, this type of underperformance should put it on traders short radar.
The bear flag just below the 200day moving average looks
very similar to the bear flag below its 200day during the summer of 2011. Back
then, the stock failed after a headfake close over the 200day and fell a quick
10% before recovering. The action since the October high seems very similar.
The stock got hit hard off its highs and fell right to its 200day. Now its in a
bear flag just below the 200day as the 50day comes down to cross the 200day...any day now.
Aggressive traders may want to enter a short here and look
to cover near or below $32. Although I am looking for a repeat of the action
from 2011 into year end, watch volume and price for hints of a change in
direction as a close over its most recent closing high near $34.75 will get it
moving higher again.

Monday, December 17, 2012
Watching X...
Watch US Steel this week. Moves like that from friday usually
have follow thru...especially for stocks that have a high 25% short interest .
(chart from fridays close).
I would expect the stock to move to $25 in the near term,
possibly higher. Any light volume pullback towards its 200day moving average
should be monitored closely. If it holds then that would be a good sign for an
extension...if not, use that as a sell stop and get out.

Wednesday, December 12, 2012
S&P 500 most Overbought / Oversold
Bespoke has a list of the most overbought and oversold stocks in the S&P 500 that i thought would be worth reposting HERE or here http://www.bespokeinvest.com/thinkbig/2012/12/12/most-overbought-and-oversold-sp-500-stocks.html
Note that tech stocks make up 9 of the top 20 stocks that are overbought. This fits into my recent post that Im not feeling the love in XLK.
Note that tech stocks make up 9 of the top 20 stocks that are overbought. This fits into my recent post that Im not feeling the love in XLK.
Tuesday, December 11, 2012
WMT - Christmas season bringing the company some coal?
So many charts look like this WMT chart these days...a
collapse from its October highs to its mid November lows on the 200day moving
average, and now a rally back to its flat/descending 50day and 100day moving averages . This is not necessarily a
"dead-cat" bounce in one of the worlds largegst and most successful
retailers, but it is nearly a textbook example of a high probability short.

Trade premise:
Enter short somewhere between $71.50 - $73 and cover near
the 200day moving average currently near $68.50 (unfortunately I wrote this
midday when the stock was trading near $72 - but the analysis still holds). Those
less averse can start covering near $70 while those more tolerant can cover
some on the 200day moving average and keep some on if the broad market
collapses and WMT follows it lower towards $65. A prudent stop would be over
the 100day moving average currently near $73.25 (or according to your own risk
tolerance).

Monday, December 10, 2012
Micro-cap stock worth watching (FRP)
Fairpoint Communications (Symbol: FRP) is a $205mm microcap company that has
been gaining lots of traction over the past 7+ months. And although a nearly 100% gain over that time should put it on the radar of many, chances are its still not a household name at the local after work (or after internet chatroom) watering hole. "Hey Sally did you see the action in AAPL today? It was horrible." "Yea Steve, your right. But Ive been watching FRP lately instead." ...is a conversation that is probably NOT happening. But that is a good thing. Because sometimes the secret sauce of making money is discovering something before someone else does.
That seems to be the case for FRP. Not many know the name or realize its technical breakout potential. Although there are some large and well known institutional holders of the name, it just doesnt get the play it deserves because of its tiny market cap (and probably some other fancy four letter fundamental terms we wont get into here...like debt).
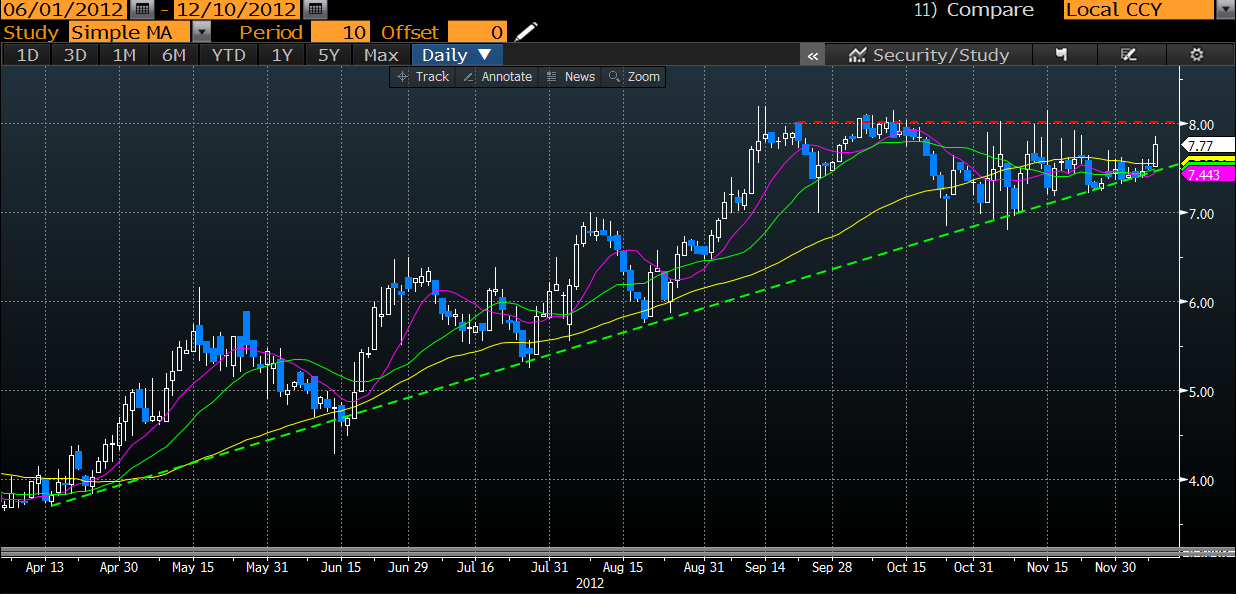
Anyway, here is the short story...the stock has been trading along a steady bullish trendline over the past 7 months where there is CLEARLY consistent buy interest...and someone big enough to not have it broken. That trendline (green dashed line) currently sits near $7.50 and continues to rise. As you can see from the horizontal red line, $8 is the near term resist and the top of a multi-month ascending triangle. An above average volume break over $8 resistance will get the stock moving as institutional buyers get more aggressive and possibly some momentum players jump on the name. This would also get the 18% short interest more involved as they need to assess and manage their risk in this thinly traded stock. Such a close over $8 would get the stock moving at least $1 higher near term, but considering where the stock came from over the past year+, an extension could be much higher towards $10/12 or above.
There are 2 ways to play this one. Either buy it on weakness towards or on its bullish trend line OR buy a high volume break over $8. Sell stops are always according to your own personal risk tolerance and should NEVER be moved lower.
Comments, other input, or agree/disagree arguments are always welcome.
That seems to be the case for FRP. Not many know the name or realize its technical breakout potential. Although there are some large and well known institutional holders of the name, it just doesnt get the play it deserves because of its tiny market cap (and probably some other fancy four letter fundamental terms we wont get into here...like debt).
Anyway, here is the short story...the stock has been trading along a steady bullish trendline over the past 7 months where there is CLEARLY consistent buy interest...and someone big enough to not have it broken. That trendline (green dashed line) currently sits near $7.50 and continues to rise. As you can see from the horizontal red line, $8 is the near term resist and the top of a multi-month ascending triangle. An above average volume break over $8 resistance will get the stock moving as institutional buyers get more aggressive and possibly some momentum players jump on the name. This would also get the 18% short interest more involved as they need to assess and manage their risk in this thinly traded stock. Such a close over $8 would get the stock moving at least $1 higher near term, but considering where the stock came from over the past year+, an extension could be much higher towards $10/12 or above.
There are 2 ways to play this one. Either buy it on weakness towards or on its bullish trend line OR buy a high volume break over $8. Sell stops are always according to your own personal risk tolerance and should NEVER be moved lower.
Comments, other input, or agree/disagree arguments are always welcome.
Tuesday, December 4, 2012
Tech (XLK) - just not feelin the love...
I just cant
get behind tech. I know a lot of people that like it and there are some diehard
believers of companies like CSCO, INTC, MSFT (MSFT recently mentioned as an
excellent shorting opportunity into the Surface release with THIS POST), but it
just doesnt get my bullish juices flowing.

If you want further proof, take a look at the XLK (SPDR Tech
ETF) chart, below. To me, this screams TREND CHANGE!
*Broke below its 1year+ bullish trendline in October
*Below all 3 of its major moving averages and currently struggling
at its 200day sma
*Underperforming the broad market from the September highs on
a relative basis by approximately 5%
*Could be in the
midst of forming the right shoulder of a large Head & Shoulders which, if
true, would lead to much lower prices.
Every cloud has a silver lining and the XLK silver lining is
2 fold...it held its June lows on a mid November test and has bounced strongly
since, and its also below the March
reaction high near $30.50 which on a bounce would not only be a much higher
H&S top, but it would take price back to the underside of the bullish
trendline setting up for a much nicer shorting opportunity.
Having said all that, I believe shorting between $29 -
$29.50 presents a high probability risk/reward opportunity to see price revert
back to the mid to low $27s over the short/intermediate term - approximately $2
lower - while using a tight stop on an above volume close over $30. If the
broad market breaks down hard and XLK fails to holds $27, then a test of its
2011 lows near $23 is highly likely.
Wednesday, November 28, 2012
BAC...an opportunity
There are a number of bullish technical developments in BAC
that have been occurring throughout the course of 2012. The numbers below
correspond to the numbers on the chart.

1) BAC has been in a bear trend for a number of years. It is
seen more clearly from the action over the past 2.5years or so. Using the most
recent primary peak after the 2009 low, seen here as early 2010, and connecting
the highs we can see that the stock crossed above this bearish trendline recently
in early September.
2) Since bottoming in December 2011 the stock has been in an
intermediate term bullish phase. A series of higher lows with constructive
volume and moving average support has lead to improving price within an
ascending triangle. This ascending triangle is highlighted by the green
up-sloping line and the red horizontal line. Ascending triangles are bullish,
but a break below can be violent - more on that later.
3) This line represents the target zone once a breakout over
$10 occurs. This area represents not only a
measured move from said breakout, but also the support/failure level from April
2011 when the stocks tumble started to accelerate.
Conclusion:
Depending on your investment/trading style, there are 2 ways
to approach this...
1) The high probability trade, and text book way to play an
breakout from an ascending triangle, is to buy a high volume close over
resistance - in the case of BAC that is $10.
2) The other way to play a possible breakout is to buy on light
volume weakness into areas of support.
First support is the 50day ma currently near $9.33 followed by $9. If
the broad market happens to fall hard and take BAC with it, much stronger
support exists near the 200day sma currently near $8.37 followed by the ultimate
line in the sand for the ascending triangle, the ascending green bullish
trendline which is currently near $8.
The caveat is a break below the ascending bullish trendline. A high volume close below can lead to a violent move lower as all those longs from inside the triangle have to manage their risk which puts pressure on price. If that happens, the bullish trade/breakout scenario as outlined above is off.
Ultimately, a high volume close over $10 is likely to lead
to a measured move rally up into the low $13 area which represents an
approximate 30% gain. If buying into areas of support and THEN the breakout
occurs, returns would obviously be much
greater.

Tuesday, November 27, 2012
Shanghai noon...can you see where we are headed?
Watch China.
I have beat this drum in the past but now that the SHCOMP
(Shanghai Composite Index) closed below 2000 for the first time since early
2009 it has to be on traders radar. Stocks to watch include, but are not
limited to, SINA, SOHU, BIDU, RENN, DANG, etc.
If the Index doesnt recover the 2000 level in the next few
days then look for the slide to continue all the way down to its long term
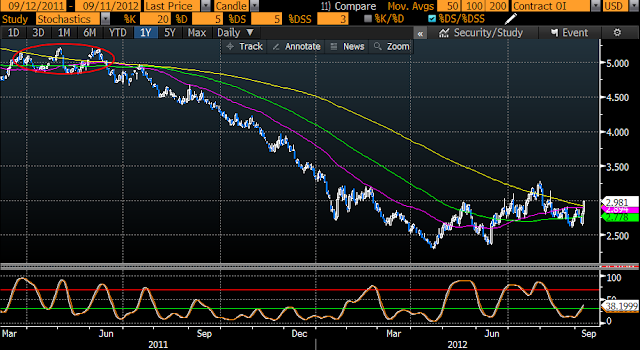
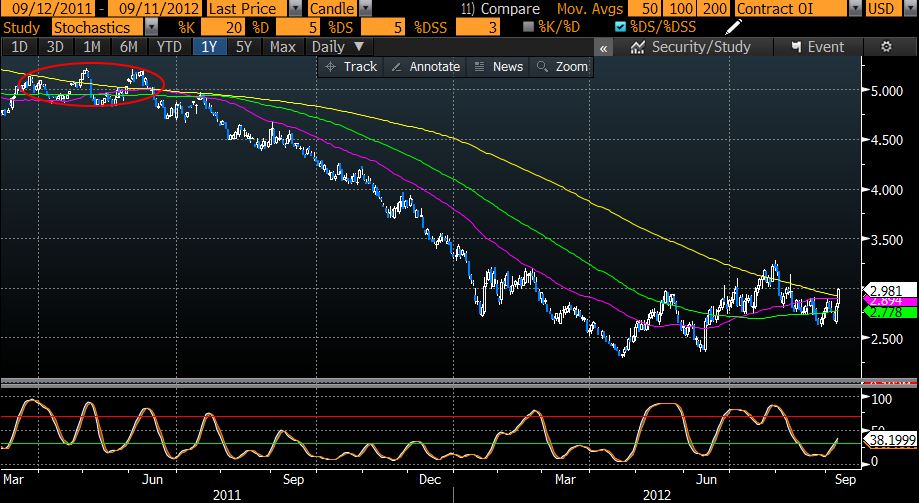
bullish trendline in the mid 1600's. Additionally, each time the oscillator turns down from a low position the index comes under pressure (see red circles)...and that is happening now. With that, additional pressure on many
Chinese stocks, including the ones above should be coming.
Remember the SINA post here from November 2nd? Although there is always the possibility of a violent bounce in
these Chinese names, SINA included, that thought on where this stock is
headed still stands, and applies to the
others as well.
As stated previously, play from the short side until the
signs tell you otherwise!

Monday, November 26, 2012
AMZN - on the lookout for some trouble.
Its cyber Monday and the stock is only up $2...what gives?
Actually, I guess those with good enough timing to get in
near the 200day moving average near $220 cant complain with the stock trading
near $242. But AMZN is in an intermediate term bear market...so longs need to
be wary here.
Technically, there was a short term buy signal on November
19/20th (along with many other stocks) that may have more legs. But, as the
saying goes "Buyer Beware". There are 2 warning signs looming after
the latest 10% bounce...first, the 50day moving average sits just above at
$243...second, the 61% Fibonacci retracement level of $245 (measured from the Sep
highs to the Nov lows) is a formidable foe for any bear market bounce.
If looking for short exposure put this one on your Christmas
list. First level of support on the downside near $235 followed by the gap near
$227...while another test of the 200day ma will be very interesting. Stops
according to your risk tolerance but a higher closing high around $247.50 will
likely be a spot for many.

Thursday, November 15, 2012
Continue to be BEARISH and defensive!
Did I mention the market is turning lower? Oh yea, see this
post BE The Bear from nearly one month ago on October 23rd.
Since then bearish posts on C, SINA, MSFT, AAPL, GOOG have been spot on!
It helps when the entire market turns south but the signs were, and still are, there. All major indices are below their respective 200day moving averages and many leading stocks are also below. That, needless to say, is unhealthy.
It helps when the entire market turns south but the signs were, and still are, there. All major indices are below their respective 200day moving averages and many leading stocks are also below. That, needless to say, is unhealthy.
And with tax increases coming in 2013, why WOULDNT people want to sell in 2012. I dont see much relief for the rest of the year. Playing from the sell/short side is likely the smart side until 2013.
Thursday, November 8, 2012
AAPL...the pain isnt over yet.
Now that AAPL is down 20% from its highs many will be talking about the bounce opportunity, and there may be one in the short term. But the short term and intermediate term trend has changed to bearish (not yet below its long term bullish trendline so primary trend still bullish).
I have touched on this stock a few times in the past and now would be a good time for an update.
I have touched on this stock a few times in the past and now would be a good time for an update.
*Stock below all 3 of its major moving averages
*The fall from it 100day break to its 200day was telegraphed
*Institutional sellers remain vigilant about unloading their
shares
Where does it stop? Not anywhere soon. Look for big levels
like $550 and $500 to act as big psychological support but real support from
the nearly 4 year bullish trendline doesn't come until the $460 area. Another
level to consider is the $420 - $445 gap zone and the very large support level
of $400.
Do I think it will get that bad? Yes...maybe not $400 but I
would expect the bullish trendline from the March 2009 lows to be tested if not
this year than early next.

Monday, November 5, 2012
MSFT - The Surface isnt The Savior
MSFT has been struggling since the spring - falling approx
10%. But the recent release of its tablet, the Surface, has put some juice back
in the stock. The Surface has put some pop back into a dead stock with a rally
of $2 last week, and appropriately right off the nearly 4 year bullish
trendline from its March 2009 lows.
Quick and dirty opinion - sell the news.
The tech sector has been struggling and MSFT stock price is
no exception. This news related pop into an area of resistance near $30 is an
excellent opportunity for longs trapped at poor prices over $30 to sell for a
small loss, and for shorts looking for downside exposure to get a good
risk/reward entry. Watch for the stock price to revert back towards its long
term trendline near $28 in the near term. Then watch for an eventual break of
said trendline for support near the $25 zone.

Friday, November 2, 2012
SINA...sloppy at best
You would think SINA should be acting better as the SHCOMP
is trying to move off its recent bottom. But that has not been the case as this
Chinese internet media company has been getting slowly slaughtered since
peaking in mid September near $70 (last $54)!
Todays action puts the stock decidedly below its 100day
moving average near $55.50 and below all 3 of its major moving averages as well
as below gap support from August. No idea whats happening inside the company
but the technicals show a deteriorating picture with near term support near
psych level of $50. That will be a big test. If the stock cant find legs there
watch the $45 zone which was the double bottom area from July/Aug for some
buyers to step in...but given the weak backdrop that is definitely not a
certainty. The stock has been in a primary downtrend since early 2011 and the
short side, especially now since below all 3 of its major moving averages, is
surely the way to play it.

Wednesday, October 31, 2012
GOOG...look out
GOOG has been like AAPL...straight up from the summer. Until
recently.
With the massive selloff from $770ish to $680ish over the
past 3 weeks it appears the bubble has burst as people continue to look to big
gainers for profit-taking. Taking a look at the chart, it seems the carnage is
not over yet. Previous times GOOG fell hard on a pick-up in volume and then
consolidated sideways, it then moved again lower before finding a bottom. Currently,
the 100day sma sits below near $657 and the 200day near $633. Given how APL
tested its 200day sma today, I would expect the pressure to also continue tin
GOOG with $650 or lower to be tested sooner rather than later...
Something to keep an eye on in the coming days / weeks.
Friday, October 26, 2012
Shanghai Composite
The equity action in China continues to confuse - even
Confucius is confounded.
The short term action, until yesterday, has been encouraging
as the Shanghai Index moves off its lows. The double bottom and rally of +6%
from the bullish engulfing in late September was the tell. But as you can see from the recent action,
yesterdays big distribution day took out the 50day sma just as momentum starts
to roll over from overbought territory - see lower portion of the chart.
Conversely, a weekly chart of the Shanghai Composite shows
encouraging longer term price action and more importantly oversold weekly momentum
that is starting to turn up - chart not included. It needs to make a higher
high and or move over a major moving average, but the foundation for such a bounce
is forming.
So not only is Confucius confounded by this confusion but so
are us mortals. Given the technical backdrop, expect the short term action to
lead to lower prices and watch for both daily and weekly support levels,
if/when tested, to hold.
Why is this important you may ask? Because the direction of
the Shanghai market may give important hints of risk on/off for trading in the
US. STAY TUNED!

Tuesday, October 23, 2012
Turning tail...BE the bear!
mentioned on Monday in this post ...
As the internals of the broad market continue to deteriorate it is important for short term traders to stay thin and nimble. Swing trading opportunities (a few days to a few weeks in duration) are plentiful but use tight stops. When (not if) we get the first big down day - something that may not happen until after the election - that will likely be the sign of THE top and further downside will be highly probable. Until then, light volume selloffs or pullbacks to previous support areas are likely to be bought. A big distribution day on above average volume will be the canary in the coal mine for me. This is no time for the light volume and anemic action to put you to sleep...be aware and read the signs.
I believe we have seen THE top for the year and should be trending lower as the primary trend changes from bullish to bearish.
Friday, October 19, 2012
Earnings misses...OUCH!
IBM MSFT MCD GOOG CMG and others...poor earnings / guidance
are all signs of the beginning of a topping process. Big volume in these names
on the selloff action also. I mentioned this in Monday's post so please BEWARE!
Wednesday, October 17, 2012
Citi (symbol: C) watching closely
Citi is looking frothy up here as it taps its highs near $38
from March earlier this year. A few interesting things about the current stock
price and why it feels poised to pull back 10% or so.
*The volume spike highlighted on the lower volume chart is very similar to the volume spike that preceded the March top.

*The last time when Citi was this far above its 200day sma
(approx 20%) the stock fell back to its 200day sma within 6 weeks, before
falling significantly below.
*The first attempts at a double top usually fail...thats WHY
they call them double tops.*The volume spike highlighted on the lower volume chart is very similar to the volume spike that preceded the March top.
Watch todays action (as well as action in the next few days)
for a potential Evening Star, Abandoned Baby Top or Doji candlestick formation
as a sign for a reversal. Support on the way down starts near $36, then more formidable
short term support near $34.

Tuesday, October 16, 2012
Place your bets...LVS & WYNN
LVS and WYNN are both poised to run here...especially after
the strong performance of the broad market yesterday and this morning
pre-opening. Yesterday WYNN closed over its high close of $115.69 from 9/19 and
should soon push to $120+ while LVS has been acting well the past few days as
the 50day sma is crossing over the 100day sma as the stock sits on the $45
pivot. A high volume push over sets up the stock for an extension back towards
$48.
Monday, October 15, 2012
Todays potpourri: Falling behind...an AAPL a day...internal bleeding.
Wow, I didnt realize I havnt posted anything in a month. I've been very busy with personal issues but THAT is ridiculous. There have been some great swing trade opportunities recently, especially in the coal space - I will try my best to post more.
Until then, just looking at the last 2 posts from September it seems the SHCOMP is still struggling slightly below the level mentioned last month. On a short term basis is has made some improvements but for the longer term, although improving, it still has some work to do.
As for the Nat Gas call, that was spot on. Nat gas rallied hard (some 20%+ from my mention) and pulled a lot of sector stocks with it as well as helping the coal stocks rally as people think more about the industry switching form more expensive gas to cheaper coal. Can you say "pair trade"?
As an aside, from what I can tell about the recent action AAPL has found some serious institutional selling. Even on days when the broad market is rallying this stock is struggling to hold on. Watch major moving averages as inflection points - the stock recently fell hard after breaking its 50day sma, and similar to the last time it did this, it fell straight to its 100day sma where it is close to now. If institutional money doesnt start flowing back in, look for further price pressure. This is a favorite of mine and many others to trade short term and there are constantly multiple short term swings to play on both the upside and downside.
As the internals of the broad market continue to deteriorate it is important for short term traders to stay thin and nimble. Swing trading opportunities (a few days to a few weeks in duration) are plentiful but use tight stops. When (not if) we get the first big down day - something that may not happen until after the election - that will likely be the sign of THE top and further downside will be highly probable. Until then, light volume selloffs or pullbacks to previous support areas are likely to be bought. A big distribution day on above average volume will be the canary in the coal mine for me. This is no time for the light volume and anemic action to put you to sleep...be aware and read the signs.
Tuesday, September 11, 2012
Natural Gas looking good
In addition to moving over all 3 of its major moving
averages in the past 6 months, natural gas has made a series of higher lows
since bottoming in April of this year. Additionally, it moved over its 200day
moving average today with a short term oscillator moving higher from an
oversold condition. If price can sustain itself over the 200day for a few days,
it has a chance of moving significantly higher towards 3.50.
The big caveat is that natural gas has been in a strong bear
trend for some time, and the last time it acted similarly with moving over all
3 of its major moving averages after a sustained downturn (see red highlighted
area), price eventually failed to improve and another downtrend ensued. All buy
signals should come with a warning sign...but given the flammable nature of
natural gas, this one should come with an exclamation point!
Along with the strength in natural gas comes strength in
natural gas stocks...watch high short interest stocks prepared to move or
already moving over a major moving average on above average volume for squeeze/extensions.
Monday, September 10, 2012
Impressive week for the Shanghai Composite
By any technical measure, China has been in a bearish trend
for a while. But last week the Shanghai Composite Index (SHCOMP) put an
impressive bullish engulfing candle on the board for the first time in a while.
The last time was in June 2011 - only a 3% gain following but it did not come
after an extended downturn. Prior to that was in July 2010 which did come after
an extended downturn and led to a +20% gain in 4 months.

If the strength seen from last week can hold, look for an
extension towards the 2200 area and bearish trendline connecting peaks from
2011. Above that would be near 2450 then the more formidable 2600 level which is former support turned resistance
from 2010 and 2011.
If the recent strength does NOT hold and the recent lows
near 2000 are taken out, then look for a continuation of what has been a long multi-year
bear market in China. 2012 is the Year of the Dragon in Chinese astrology, but
I wonder if they have a sign for the decade? If so, then this may be the Decade
of the Bear.

Tuesday, September 4, 2012
August was an interesting month on many fronts (the EUR,
China, deteriorating internals, etc), but one in particular that stands out to
me is the outperformance of small caps vs large caps domestically. This we can
see in the ratio chart below of IWM vs SPY.

For the month, small caps outperformed large caps by almost
3%. Although you may not think 3% is significant,
it does show a more "risk-on" or "performance-chasing" approach and this may help equities overall as
we head into the beginning of a new month which is typically bullish.
This relative outperformance of small caps to large caps has
happened before, most recently in June/July, but these moves have been
counter-trend as the overall trend is down/bearish. So this may be another
short term push - watch for it to end soon after the beginning of the month
inflows...

Monday, August 27, 2012
S&P sitting in the crosshairs
The broad market is right in the crosshairs. Crosshairs of
what you ask? Well that depends on your perspective.
If you are a bull then you are seeing that the S&P is
close to closing over its recent high close of 1415 and setting up for a major
extension higher. This camp is talking about QE3, the effects of an election year, a resurgence of equity buying
with a risk-on attitude, and looking for a 1500+ level for the futures. Yes
Alice, there is a Wonderland.
If you are in the bear camp then you are seeing breadth
deteriorating as the internals struggle to support a rising market. You are
also talking about declining volume, a rise in the AAII bulls to its highest
level since the spring (contrarian), and a return of the S&P to the low 1300's or lower. Humpty Dumpty has to fall somewhere!
Both camps have a strong leg to stand on and the argument is
heating up as we head into the election. What camp you are in is a choice. One
that is either forced upon you because you are fully invested in your 401K /
IRA or not forced upon you because you are a "savvy" investor
who can "see" the bigger
picture and knows when things are unfolding (interestingly most of us believe we are in the 2nd category but actually none of us are).
Personally I am in neither camp. Instead I see what picture
the market is painting and try to decipher what it means...like an art
appraiser looking at a piece of art. Is that a Pollock worth millions or is
that a 5 year old throwing paint on a canvas? Sometimes the appraiser is
correct and sometimes not so. But in most cases, the artwork speaks differently
to different people.
So here we are - sitting in the crosshairs. To some its the
beginning of a major advance, and to others a major decline. To me, its the
crosshairs of a fence where we could go either way. Whats your appraisal?
Thursday, August 23, 2012
S&P bearish engulfing
There have been a few bearish engulfing candles since the strong rally started in early June but none have come after a significant move higher...like the one from yesterday. Can this rally extend to 1440 or so? Yes. But when we start seeing distributions like the latest bearish engulfing after a strong move higher then the warning is there for all to see.
As the post from yesterday warns, buyer beware!

As the post from yesterday warns, buyer beware!

Tuesday, August 21, 2012
Lowry's...buyer beware
As the equity market keeps extending the internals do not support much more of an extension. I will leave you with a quote from Lowry's...and a blurb from their latest piece.
"The bottom line is, the current rally appears to be based on increasingly weak underpinnings. By a number of measures, including some that generate relatively infrequent signals, the rally has become overextended. Meanwhile, investors appear to be growing more comfortable with the idea that any interruption in the rally should be very brief and likely followed by moves above the April and May highs in the market indexes. All this is accompanying a rally that appears increasingly dependent on a lack of selling. Yet, extended prices and a sense of complacency is probably a combination more likely to lead to an increase, rather than a decrease in Supply, especially in the event of any unexpected bad news. And that could bring a quick end to the rally."
"The bottom line is, the current rally appears to be based on increasingly weak underpinnings. By a number of measures, including some that generate relatively infrequent signals, the rally has become overextended. Meanwhile, investors appear to be growing more comfortable with the idea that any interruption in the rally should be very brief and likely followed by moves above the April and May highs in the market indexes. All this is accompanying a rally that appears increasingly dependent on a lack of selling. Yet, extended prices and a sense of complacency is probably a combination more likely to lead to an increase, rather than a decrease in Supply, especially in the event of any unexpected bad news. And that could bring a quick end to the rally."
Wednesday, August 15, 2012
Ford (F) update...
Ford had a strong morning and was butting up against its very
important 50day moving average at noon but the bears showed who remains in
control and the stock closed back near its lows. The gravestone doji that
formed as a result is certainly NOT PRETTY! The strong rejection at the 50day
makes that an even more important level to watch on a possible retest.
If the stock can get through its 50day on above average volume it will set up for an extension to $10 resistance or possibly beyond. But, as we saw yesterday, that is countertrend for the moment. Right now rallies still need to be sold. As mentioned recently, a break of the $9 level could be devastating for the stock and lead to much lower prices.

If the stock can get through its 50day on above average volume it will set up for an extension to $10 resistance or possibly beyond. But, as we saw yesterday, that is countertrend for the moment. Right now rallies still need to be sold. As mentioned recently, a break of the $9 level could be devastating for the stock and lead to much lower prices.

Tuesday, August 14, 2012
Watch your DAX
The German DAX has been a good barometer for all things global. When it broke below its 200day moving average and looked like it was going to roll, global equities also looked vulnerable. Now that the index has recovered and raced back to resistance, we are experiencing a similar move here in the US.
Keep an eye on the support and resistance lines as outlined below, and more importantly look for a high volume break that is sustained for at least 2-3 days, for a continuation move in the direction of the break. Equities here and likely in Europe have been advancing on weak breadth and volume, but a convincing move over resistance could get things moving aggressively and catch investors off guard.

Keep an eye on the support and resistance lines as outlined below, and more importantly look for a high volume break that is sustained for at least 2-3 days, for a continuation move in the direction of the break. Equities here and likely in Europe have been advancing on weak breadth and volume, but a convincing move over resistance could get things moving aggressively and catch investors off guard.

Monday, August 6, 2012
JPM ascending triangle could provide some fireworks
An ascending triangle in a bear market presents problems for
swing traders. It is a bullish pattern,
but in the context of a larger bear market it can be thought of also as a bear
flag. In either case the ascending trendline as well as the horizontal
resistance line that make up the triangle, can be used as trading pivots for an
extension in the same direction.

This brings us to the daily chart below of JPM. The
horizontal resistance line near $36.90 which is just above the 200day moving
average as well as where the stock opened after gapping down in May, was tested
today, and for now failed. Todays high was $36.80...todays 200day moving
average $36.82.
Overall, IF this horizontal resistance line is taken out on
above average volume look for a strong extension towards the gap down area from
May near $41. Aggressive traders may look to short here (using a tight stop)
with the view that the stock will return back to its bullish trendline currently
near $35.50. But given the resilience of
a broad market retreat, the risk reward appears to be to the upside. Traders
playing the swing up would (depending on their risk profile) look to buy between
here and the bullish trendline near $35.50 or buy on a high volume move over $36.90
with the expectation of an extension towards the $40-$41 area...approximately 8-10% higher.
Thursday, August 2, 2012
Ford (F) looking into the abyss
After its incredible run from the March 2009 lows to its
high in early 2011 near $19, Ford is in a very precarious technical position. The stock has made a series of lower lows with
psychological support in the $10 area that was broken recently. Now it is
trying to hold treneline/neckline support currently near the $8.80 area.
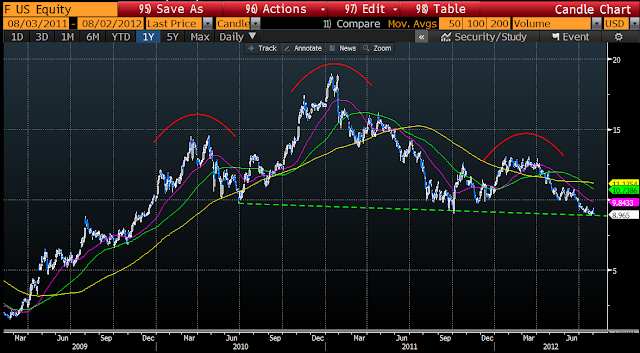
There are 2 ways to view at the technical weakness. Either 1) as a large head and shoulders as
outlined by the red arcs. This is the worst of the 2 views as a measured move
from a break below the neckline would take the stock to near 0. Not highly
likely. Another way to view the technical weakness is 2) a somewhat descending
triangle (not textbook because the base is declining and not horizontal). This
view would have a minimum measured move of approximately $4 lower to $5 on a
definitive break of trendline support near $8.80.
The only thing that would negate the negative look in F is
if the stock can regain the $10 area and much more importantly the descending
trendline currently near its 200day moving average near $11. That would likely
get the stock moving back up nicely. But if that does not happen, and the stock
does break below $8.80 on a pickup in volume, then look for a move to much
lower levels.

Monday, July 30, 2012
KBH - constructive bull flag
As the S&P rockets back into its bear flag trading range
catching me (and possibly many others) off guard and setting up for a
continuation to the top of the channel somewhere near 1400+, the bull flag in
KBH is looking interesting from a swing long perspective.


The first chart below shows KBH in a long primary bear trend
(see big red arrow)...so it is prudent to start off this analysis by saying
buyer beware. But if you look at the activity of the stock when it is over its
200day moving average (yellow line) as shown by the small green arrows, then
you can see the intermediate and short term bull trend within that primary bear
trend provides opportunities to play as a swing long.


The second chart above shows the action over the past year or so. Here it is easier to see how KBH has made higher highs. Most recently the stock has moved over its 200day average and is in the midst of a constructive bull flag. For those of you who like swing trades, this one sets up nicely for a buy in the $9.20 - 9.50 area or depending on your risk tolerance, on a break over the top of the bull flag channel currently near $10. Stops should be below the 200day moving average and the price projection on a break over the bull flag is at a minimum to the top of the flag near 10.80...a nice percentage gain.
Tuesday, July 24, 2012
S&P...kinda not looking so great
Well, after some volatility around the 100day moving average
and what looked like what was going to be an extension higher with the help of
strength in the DAX, the S&P kinda caved in the past 2 days and is now back
to its 50day moving average. This volatility is likely chopping around short
term traders, but the underlying strength, or lack thereof, remains weak.

Many big name stocks such as IBM MSFT CSCO etc are below
their respective 200day moving averages. Definitely not the kinda stuff that sustainable
rallies and bull markets are made of. And today small caps, as represented by IWM,
also closed below its 200day moving average just as its 50day is getting close
to crossing below the 200day. This is not setting up to be a fairytale ending.
So for the bigger picture, the chart below is a daily of the
SPY and clearly shows a close below the bear flag that has been forming since
the June lows. I was going to put this out yesterday, but after falling outside
the channel during the day, SPY closed back in the channel and I didnt want to
send any false warning signs before it was necessary. BUT NOW IT IS NECESSARY!
Unless AAPL, which reports today, can save the day, I suspect things are going
to get much worse before they get better.
A similar channel occurred this spring and you can see what
happened as price closed below the channel and below the 50day ma...it wasnt
pretty. I suspect something similar will happen this time. Unless of course
either AAPL or The Bernake can save the day...and soon!

Friday, July 20, 2012
EURO...
I was going to write about how the S&P futures are
getting slammed this morning but it seems more important to write about WHY
theyre getting slammed. Just take a look at the EURO. The strong weakness from
todays session is taking out all the gains made over the past 5 days in one
shot!
Not only is that troubling but the nearest low close in the EURO is 1.2203 and it is currently trading below 1.2200. If it remains down here for the session then this sets up an extension move lower towards the 1.20 area in the near term. This will weigh HEAVILY on stocks and should test the resolve of the equity bulls recent strength.
As I mentioned with this post (EURO uh oh), the weakness in the EURO needs to be followed very, very closely.

Wednesday, July 18, 2012
Broad market(both S&P large caps and IWM small caps) conditions improving rapidly
Many posts ago on June 17th with this post Broad Market Status Quo, I said that it would take a move up in the broad market on increased volume, coupled with a move higher in the DAX as well as the Shanghai Composite to negate my bearish view. Well the broad market has increased its upside volume on this advance, and the DAX as represented by the chart immediately below recovered not only its 200day moving average below 6400 but above its 100day moving average yesterday above 6600...quite impressive Ms. Merkel! But the one laggard remains to be China, as shown in the lower chart.
The one improving aspect of the Shanghai Composite is the structure of the recent candles. As you can see in the green circle on the right, yesterdays hammer is very encouraging, especially since it came after a long downtrend and some constructive bottoming action. Actually, the recent action looks very similar to the green circled area on the left from late last year/early this year which saw 2 hammers with the second hammer also being a bullish engulfing. So although China still remains in a downtrend, a risky countertrend trade could be finding some buyers at these levels...so watch Chinese stocks here (names like BIDU, SINA, SOHU, etc). The Shanghai Composite really needs to make a higher high to get out of its funk and reverse the downtrend but risky traders may want to take a shot on the long side here using a tight (new lower low) as a stop.
Anyway, encouraging signs here in the US as well as with the leader in Europe (DAX) are suggesting we may be in the midst of a summer rally. There are many bulls out there hoping this is the case. But with some big name stocks such as IBM, INTC (yes tech has been the laggard sector I know) as well as some other heavy weights below their respective 200day moving averages, I just need one more piece of the puzzle to become a firm believer in a melt-up rally to 1400+ myself. Ni hou Shanghai!


Monday, July 16, 2012
Crude on the move
The price of crude has been on the rise recently after
falling off a cliff from its early May highs of $105 and most recent high of
$110 in Feb/Mar. But having successfully tested the low area from late 2011
near $78 it has been on the rise and could be in the midst of an inverse head
and shoulders.
More interestingly is that the price is now over its 50day
moving average of $87.20. The last time this happened, as highlighted by the
green circles on the chart below, was late 2011. In the weeks/months following
that development the price of crude continued to rise substantially. It may or
may not be that crude is setting up for such a large rally, but it should be
good for a near term bounce back up towards its 100/200day moving average area
near $95. Watch energy stocks (components of the XLE specifically) in the near
term to benefit most from this possible development while airlines could be on
the other side of that bias.
(Adding this after the initial post - see that volatility has declined in crude options with this story from Bloomberg. With lower vol, this could be one getting-more-inexpensive way to play a 5-10% move from here).
(Adding this after the initial post - see that volatility has declined in crude options with this story from Bloomberg. With lower vol, this could be one getting-more-inexpensive way to play a 5-10% move from here).

Thursday, July 12, 2012
S&P - The quick, and dirty
Im sure there are many scenarios out there for
higher/lower broad market prices, with one strong argument being that the last 6
months of an election year tend to be very bullish. But looking strictly at the
technicals it paints a different picture.
For those fans of fibonacci, using the March 2009 lows as a base, the peak into April 2010 was corrected to 38% (to 1000), then again the peak into the summer of 2011 was corrected to 38% (to 1100). If, and thats a big IF, the current peak from this spring was the end of the bullish 5 wave sequence from the March 2009 lows and the S&P was to correct to 38% Fibonacci retracement then we are looking at an ultimate target around 1130.
Important levels to consider on the way down in case something of that magnitude does unfold over the coming months...the 200day moving average currently near 1300, 1250/60 which represents the launch area in December 2011 as well as the retest in early June 2012, and 1200 which is a big psychological area and that would likely have QE3 talk furiously buzzing. The only thing that would negate my negative bias for the broad market in the coming months as described above is a close over the recent highs of 1368.
Just something to think about after the fireworks of the past 2 summers. After all, isnt the definition of insanity doing the same thing and expecting a different result?
Wednesday, July 11, 2012
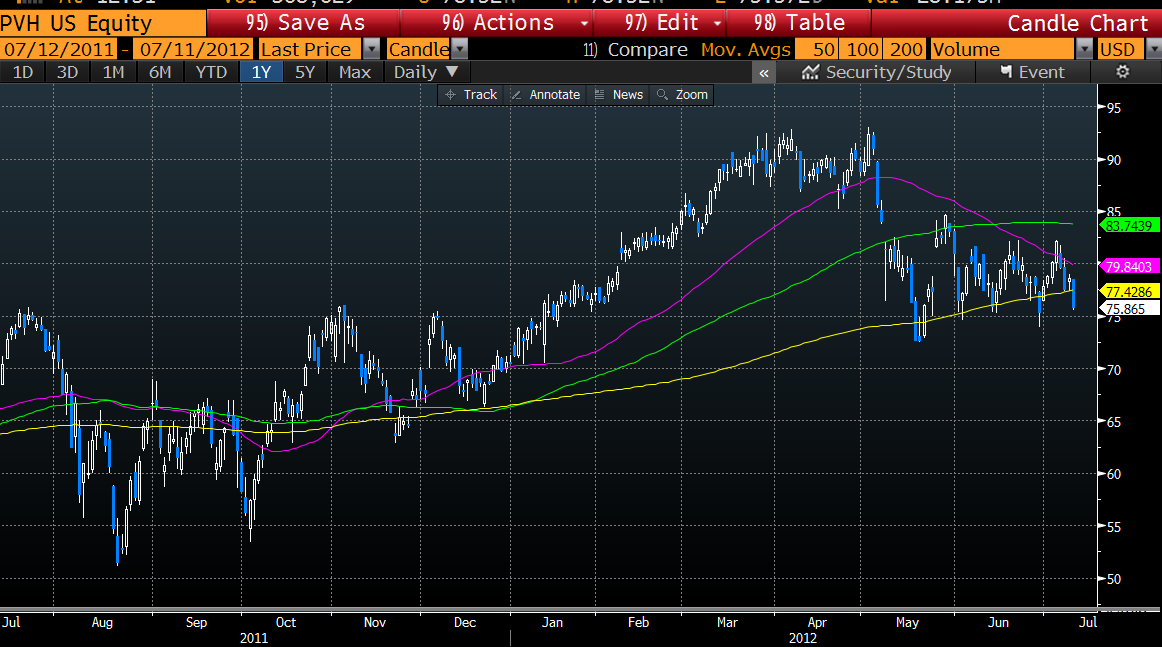
PVH...standing on the precipice
As the broad market continues to act shaky there will be an
increase in the number of stocks that break technical support...some well
defined areas like major moving averages (as in this post from IBM yesterday)
while others may be less textbook.

One such example that jumped onto my radar today was PVH.
The stock has been flirting with its 200day moving average since May and
continues to be in a bear flag. Although the 200day has been successfully
defended so far with breaches below not lasting for more than 2 days, this type
of activity needs to be monitored closely - especially since this is in a
discretionary sector. A high volume close below, especially if sustained for
more than 2 days, will likely lead to much lower prices. Look for first support
to be ~$70 with much stronger support ~$65.
Tuesday, July 10, 2012
IBM below its 200day...
With IBM below its 200day moving average watch out. Although this stock has been below its 200day recently, as well as las summer (yes both were headfakes) this time looks different as the stock has been in a strong downtrend since its April peak.
Watch previous support around $180 as its first real test.

Watch previous support around $180 as its first real test.

Monday, July 9, 2012
IWM outperforming S&P on relative basis
Although I am not a big fan of the overall market at this juncture the chart below is impressive. Its is a relative performance chart of small caps (IWM) vs the broad market (SPY). As you can see IWM has outperformed SPY by over 4% since mid June. Despite deteriorating conditions in Europe and China, this is encouraging for the bulls.
Will be interesting to see if this continues in teh near future or if its just a short term blip.

Will be interesting to see if this continues in teh near future or if its just a short term blip.

Friday, July 6, 2012
Bad jobs number...S&P heading lower
Not a very friendly employment number. The S&P futures
reacted strongly to that disappointment and today could turn into a trend down
day, especially with the futures back below the 100day moving average of 1357.
Watch that level as an inflection point.
Also, dont forget the EURO...its on the slippery slope to
1.20. As a reference, the last time it was there was June 2010 when the S&P
was trading near 1,000...Food for thought!
Enjoy your weekend.

Thursday, July 5, 2012
EURO - uh oh.....
This is not a pretty picture. The EURO is now under 1.25 and not looking at support until the 1.20 area.
This is important.
This is meaningful.
This needs to be given your full attention.

This is important.
This is meaningful.
This needs to be given your full attention.

Tuesday, July 3, 2012
AAPL...making higher highs
A few posts ago (actually here: APPL's curves don't look so great) I wrote about how the rounding top in AAPL is looking quite daunting and a fall below the 100day moving average will lead to much lower prices. I also mentioned that the only thing that would change my mind about that technical drop would be for the stock to make a higher high over its June highs.
Well yesterday AAPL did just that...made a higher high over $591.
This should lead to an extension to the upside - but watch for this price to act as an important pivot point in the next few days if the stock happens to not explode higher from here. Although the stock did make a higher high, its real test will come if price can hold over that important mark in the next few days. If so, then the AAPL gravy train should make many holders very very happy in the weeks and months ahead...but if not, and the stock were to fall back below $591 on heavy volume and more importantly below its 100day moving average, then the fall to previously mentioned levels will likely be near.

Monday, July 2, 2012
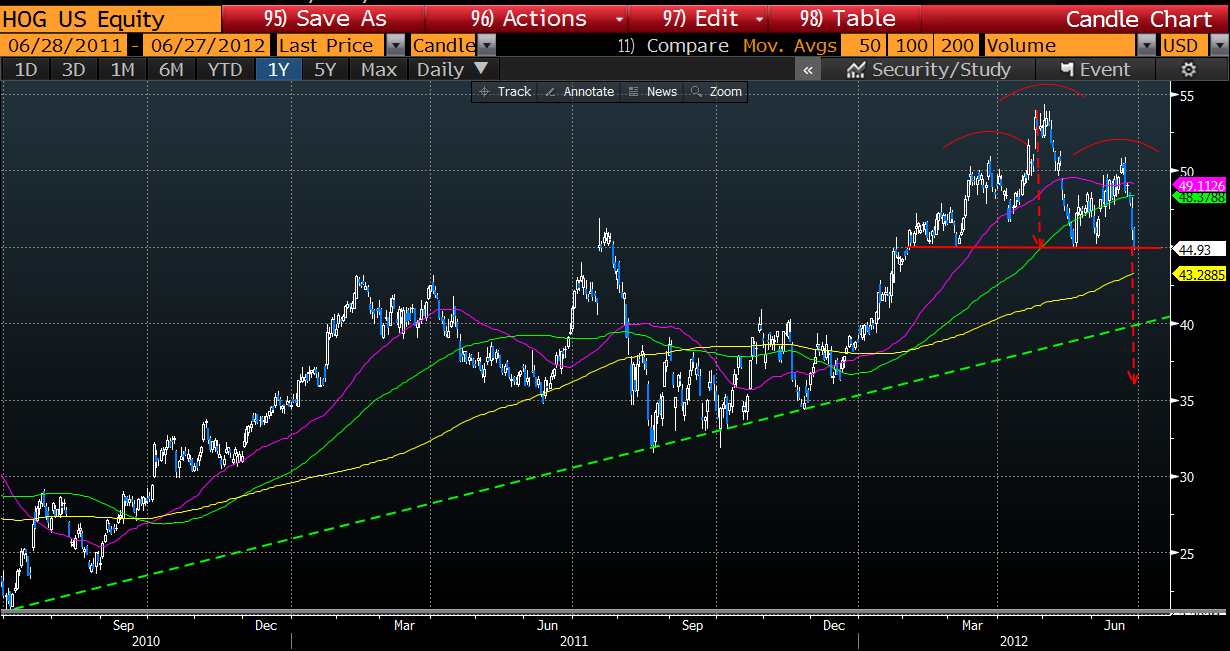
HOG - This Harley is starting to sputter
It was with this post on May 20th that I mentioned the long
term bullish trendline in HOG as a very good place to step in on HOG in case
the stock collapsed. That line is represented below by the green dashed line. But since then, there has been a large Head & Shoulders that is well defined with an imminent break of the neckline coming (even though this chart is from a few days ago it is still valid).
So what happens on a high volume neckline break down? A measured move below the neckline equal to the distance of the red arrow. There will be pauses along the way down like the 200day moving average and below that at the long term bullish trend line where bulls may defend vehemently - after all the stock is in a primary long term bull trend. But if it collapses, a completion of the measured move could take the stock all the way down towards the $35 area if shorts pile on and longs really get nervous about HOGs prospects in a slowing economy.
Something to consider if you are long or looking for a high probability technical setup for short exposure. Any other traders who are looking at this same setup and are playing it will use stops according to their risk tolerance...likely somewhere a little above the neckline.So what happens on a high volume neckline break down? A measured move below the neckline equal to the distance of the red arrow. There will be pauses along the way down like the 200day moving average and below that at the long term bullish trend line where bulls may defend vehemently - after all the stock is in a primary long term bull trend. But if it collapses, a completion of the measured move could take the stock all the way down towards the $35 area if shorts pile on and longs really get nervous about HOGs prospects in a slowing economy.
Friday, June 29, 2012
Merkel to the rescue
I guess that was Merkel's version of the PPT.
This was obviously big news overnight and has out markets
rallying hard on the heels of a strong rally across Europe. The leading index
of Europe - The DAX - opened on its 200day moving average of 6280 and is now
also over its 50day moving average at 6390. This are 2 very positives that
should lead to an extension in the near term. Watch your shorts...and I dont
mean the swimming kind for the upcoming 4th of July holiday!
Thursday, June 28, 2012
S&P futures...be on your guard
The S&P is breaking short term support here as the bearish flag gives way. First level of support below 1318 exists around 1310 with stronger support near the June 8th and 12th lows around 1303-1305. Banks look particularly weak today...sell the rallies.


Tuesday, June 26, 2012
DAX - Merkel better send in the PPT - Macht Schnell!
With the oscillator below entering the danger zone and just about ready to turn down, Ms Merkel better think about sending in the Plunge Protection Team to prevent the DAX from testing 6000 and eventually collapsing towards 5500 or lower. Yes folks, things are deteriorating in Europe rather quickly if you haven't noticed.
As I have said in the past, without the DAX and without China's Shanghai Composite, our own broad market S&P will NOT be able to have a sustainable rally. This chart, and especially the oscillator, looks eerily similar to some of our own stocks and ETF's.
Remember the trend is your friend, and right now its down, so play it that way.

AAPL's curves don't look so great in this picture....
Any apple I have ever eaten has been nicely curved in the right places and most have been juicy to the core. But unlike the your favorite apples to eat, the curves in this AAPL aren't so appetizing.
In addition to all the technical jargon I have been using here on this blog there is one that I don't think I have mentioned yet...the rounding bottom and rounding top formations. Below is a good example of what appears to be shaping up as a rounding top. Although AAPL is making higher highs, it is doing so with less vehemence each time and is now most of the way through what is developing into a bad technical posture.
Add to the weakening backdrop a falling 50day moving average that is close to crossing below the 100day moving average and you have what may well be a technical signal developing in AAPL that can possibly take the stock down to its May lows if not all the way down to the $500 area.
For all you AAPL lovers out there (personally I love their products, own a few of them, and have benefited from the explosive stock price - so I'm a lover, not a hater) I am not trying to bash the stock just for the sake of it. This is an unbiased opinion about the what the chart is saying to me. Essentially it is a picture that displays the emotions, thoughts, and expectations of investors and traders. Others may see it differently, but the only thing that will change my mind about MUCH lower prices for this stock is if it makes a higher high over its June highs. If that doesn't happen soon, and AAPL breaks below its 100day moving average, this apple is going to fall from the tree.

Monday, June 25, 2012
S&P futures - trendline selling well publicized
I have spoken about fractal patterns in the past and today was another good example of just that - although today was a trendline example instead of pattern. On the intraday futures chart (actually going back to late Friday) there was a trendline connecting highs that was used by sellers today.
For short term traders, the first time you can draw a treneline between any 2 peaks or troughs you should - it may not ALWAYS work in your favor but it gives you the first indication of where support/resistance may appear. In this example, after the first peak in the overnight session if you drew an extended line you would have been able to know where the sellers could appear. First resistance was between 8am and the opening, then late in the day sellers showed up again near the trendline right near the close .
Just another tool in your belt when trying to beat Mr Market.

Look out below...S&P setting up for fall.
Remember that overbought condition I mentioned in the broad
market...how an important oscillator was extended and due for a pullback...well
here it is finally crossing down from a high level. With the longer term
momentum still falling in the weekly chart and the short term now turning down,
it appears the broad market is heading for lower prices. The area of the 200day
moving average should be the first battle ground (call it 1295-1305) but it is
likely to be just a pause towards lower prices. Ultimately this leg down should
settle somewhere in the low 1200's.

Keep a close eye on the momentum indicators and continue to
play from the sell side.

Friday, June 22, 2012
Russell Rebalance
Today is a Russell rebalance day so the close should make for some interesting action on heavy volume. Watch the heavy short interest names especially.
Enjoy the weekend!
Enjoy the weekend!
Tuesday, June 19, 2012
XLP - a glance at relative performance
Sometimes to get a clearer picture of whats happening we have to look at relative performance. That is, one stock, ETF, Indices, etc vs another. The daily chart below is a relative performance (or ratio) chart of the XLP vs the SPY with an oscillator on the bottom portion. The quick look at this chart shows after underperforming the broad market for Q1 2012 by nearly 8%, consumer staples (XLP) has outperformed the broad market SPY in Q2 by approximately 4%. But more importantly the technical backdrop shows that recent outperformance waning and possibly setting up for a reversal.
2 factors lead me to believe XLP is close to a period (likely months) of underperformance vs the broad market...a breach of its 20day moving average and a crossing down from an extended level of the oscillator on the lower portion of the chart.
As you can see from the chart below in December 2011 this ratio crossed below its 20day moving average but it was at a time when the oscillator was just crossing up over the 0 line with upwards momentum in its favor. Mixed signals with no high probability setup. Not only until momentum was extended, did another fall below the moving average lead to a sustained decline. These 2 instances occurring together made the probability of a fall much greater. And at the risk of stating the blatantly obvious, a high probability trade is where we want to be.
Currently the setup is similar...the ratio is crossing below its 20day moving average with the oscillator crossing down from an even higher extension than that of late 2011. At this point the only thing that can negate the weak setup is a move over 0.26 which is the recent high as well as the highs from late 2011. Otherwise look for the ratio to fall (XLP underperforming vs SPY) back towards 0.245 or lower in the weeks/months ahead.
How to possibly profit from this development - rotate out of XLP/components (or get short exposure to XLP/components) and get long exposure in sectors that look poised to outperform or sustain their current outperformance. Experienced traders can put on a ratio spread where they buy one (SPY) and short the other (XLP) dollar neutral. If you don't know what that is and would like to know please ask.
Also, if you are interested in building such a ratio chart but don't know how to do so please comment or contact me and I will go through it with you.

Monday, June 18, 2012
S&P short term overbought
Many of us traders, essentially short term whether you trade intraday or intraweek/month on a swing basis, can't help but monitor the intraday noise. Yes, sometimes the daily noise needs to be filtered out as I have spoken about the longer term trend being lower as highlighted by recent posts of the S&P, AAPL and others, but all timeframes must be monitored to fully take advantage of maximizing returns. So this chart of the SPY below shows how a key oscillator is approaching short term overbought. Can we push higher? Yes, but any advance, unless over a major moving average and over a recent high, has a high probability of failure.
Referencing the chart below and more specifically last summer, we can see how the SPY oscillator crossed up while making a higher low in late August (white circle). That cross higher led to a push in the SPY towards its 50day moving average (purple line) where it failed as the oscillator below reached the red horizontal resistance line. The 50day moving average was resistance until finally broken to the upside in early October putting a sustainable bottom in place.
Recently the SPY has acted similarly, with the oscillator crossing up while making a higher low and again, just like in the summer of 2011 pushing up against its red horizontal resistance line. What will transpire from here is likely a similar outcome to that of the last time...a struggle near this 50day and 100day resistance zone with a pullback to lower levels. How much lower is the key unknown variable here and there will be many factors in the mix to help determine a bottom (tradeable or long term) when that scenario unfolds.

Subscribe to:
Posts (Atom)