This was obviously big news overnight and has out markets
rallying hard on the heels of a strong rally across Europe. The leading index
of Europe - The DAX - opened on its 200day moving average of 6280 and is now
also over its 50day moving average at 6390. This are 2 very positives that
should lead to an extension in the near term. Watch your shorts...and I dont
mean the swimming kind for the upcoming 4th of July holiday!
Friday, June 29, 2012
Thursday, June 28, 2012
S&P futures...be on your guard
The S&P is breaking short term support here as the bearish flag gives way. First level of support below 1318 exists around 1310 with stronger support near the June 8th and 12th lows around 1303-1305. Banks look particularly weak today...sell the rallies.


Tuesday, June 26, 2012
DAX - Merkel better send in the PPT - Macht Schnell!
With the oscillator below entering the danger zone and just about ready to turn down, Ms Merkel better think about sending in the Plunge Protection Team to prevent the DAX from testing 6000 and eventually collapsing towards 5500 or lower. Yes folks, things are deteriorating in Europe rather quickly if you haven't noticed.
As I have said in the past, without the DAX and without China's Shanghai Composite, our own broad market S&P will NOT be able to have a sustainable rally. This chart, and especially the oscillator, looks eerily similar to some of our own stocks and ETF's.
Remember the trend is your friend, and right now its down, so play it that way.

AAPL's curves don't look so great in this picture....
Any apple I have ever eaten has been nicely curved in the right places and most have been juicy to the core. But unlike the your favorite apples to eat, the curves in this AAPL aren't so appetizing.
In addition to all the technical jargon I have been using here on this blog there is one that I don't think I have mentioned yet...the rounding bottom and rounding top formations. Below is a good example of what appears to be shaping up as a rounding top. Although AAPL is making higher highs, it is doing so with less vehemence each time and is now most of the way through what is developing into a bad technical posture.
Add to the weakening backdrop a falling 50day moving average that is close to crossing below the 100day moving average and you have what may well be a technical signal developing in AAPL that can possibly take the stock down to its May lows if not all the way down to the $500 area.
For all you AAPL lovers out there (personally I love their products, own a few of them, and have benefited from the explosive stock price - so I'm a lover, not a hater) I am not trying to bash the stock just for the sake of it. This is an unbiased opinion about the what the chart is saying to me. Essentially it is a picture that displays the emotions, thoughts, and expectations of investors and traders. Others may see it differently, but the only thing that will change my mind about MUCH lower prices for this stock is if it makes a higher high over its June highs. If that doesn't happen soon, and AAPL breaks below its 100day moving average, this apple is going to fall from the tree.

Monday, June 25, 2012
S&P futures - trendline selling well publicized
I have spoken about fractal patterns in the past and today was another good example of just that - although today was a trendline example instead of pattern. On the intraday futures chart (actually going back to late Friday) there was a trendline connecting highs that was used by sellers today.
For short term traders, the first time you can draw a treneline between any 2 peaks or troughs you should - it may not ALWAYS work in your favor but it gives you the first indication of where support/resistance may appear. In this example, after the first peak in the overnight session if you drew an extended line you would have been able to know where the sellers could appear. First resistance was between 8am and the opening, then late in the day sellers showed up again near the trendline right near the close .
Just another tool in your belt when trying to beat Mr Market.

Look out below...S&P setting up for fall.
Remember that overbought condition I mentioned in the broad
market...how an important oscillator was extended and due for a pullback...well
here it is finally crossing down from a high level. With the longer term
momentum still falling in the weekly chart and the short term now turning down,
it appears the broad market is heading for lower prices. The area of the 200day
moving average should be the first battle ground (call it 1295-1305) but it is
likely to be just a pause towards lower prices. Ultimately this leg down should
settle somewhere in the low 1200's.

Keep a close eye on the momentum indicators and continue to
play from the sell side.

Friday, June 22, 2012
Russell Rebalance
Today is a Russell rebalance day so the close should make for some interesting action on heavy volume. Watch the heavy short interest names especially.
Enjoy the weekend!
Enjoy the weekend!
Tuesday, June 19, 2012
XLP - a glance at relative performance
Sometimes to get a clearer picture of whats happening we have to look at relative performance. That is, one stock, ETF, Indices, etc vs another. The daily chart below is a relative performance (or ratio) chart of the XLP vs the SPY with an oscillator on the bottom portion. The quick look at this chart shows after underperforming the broad market for Q1 2012 by nearly 8%, consumer staples (XLP) has outperformed the broad market SPY in Q2 by approximately 4%. But more importantly the technical backdrop shows that recent outperformance waning and possibly setting up for a reversal.
2 factors lead me to believe XLP is close to a period (likely months) of underperformance vs the broad market...a breach of its 20day moving average and a crossing down from an extended level of the oscillator on the lower portion of the chart.
As you can see from the chart below in December 2011 this ratio crossed below its 20day moving average but it was at a time when the oscillator was just crossing up over the 0 line with upwards momentum in its favor. Mixed signals with no high probability setup. Not only until momentum was extended, did another fall below the moving average lead to a sustained decline. These 2 instances occurring together made the probability of a fall much greater. And at the risk of stating the blatantly obvious, a high probability trade is where we want to be.
Currently the setup is similar...the ratio is crossing below its 20day moving average with the oscillator crossing down from an even higher extension than that of late 2011. At this point the only thing that can negate the weak setup is a move over 0.26 which is the recent high as well as the highs from late 2011. Otherwise look for the ratio to fall (XLP underperforming vs SPY) back towards 0.245 or lower in the weeks/months ahead.
How to possibly profit from this development - rotate out of XLP/components (or get short exposure to XLP/components) and get long exposure in sectors that look poised to outperform or sustain their current outperformance. Experienced traders can put on a ratio spread where they buy one (SPY) and short the other (XLP) dollar neutral. If you don't know what that is and would like to know please ask.
Also, if you are interested in building such a ratio chart but don't know how to do so please comment or contact me and I will go through it with you.

Monday, June 18, 2012
S&P short term overbought
Many of us traders, essentially short term whether you trade intraday or intraweek/month on a swing basis, can't help but monitor the intraday noise. Yes, sometimes the daily noise needs to be filtered out as I have spoken about the longer term trend being lower as highlighted by recent posts of the S&P, AAPL and others, but all timeframes must be monitored to fully take advantage of maximizing returns. So this chart of the SPY below shows how a key oscillator is approaching short term overbought. Can we push higher? Yes, but any advance, unless over a major moving average and over a recent high, has a high probability of failure.
Referencing the chart below and more specifically last summer, we can see how the SPY oscillator crossed up while making a higher low in late August (white circle). That cross higher led to a push in the SPY towards its 50day moving average (purple line) where it failed as the oscillator below reached the red horizontal resistance line. The 50day moving average was resistance until finally broken to the upside in early October putting a sustainable bottom in place.
Recently the SPY has acted similarly, with the oscillator crossing up while making a higher low and again, just like in the summer of 2011 pushing up against its red horizontal resistance line. What will transpire from here is likely a similar outcome to that of the last time...a struggle near this 50day and 100day resistance zone with a pullback to lower levels. How much lower is the key unknown variable here and there will be many factors in the mix to help determine a bottom (tradeable or long term) when that scenario unfolds.

Sunday, June 17, 2012
Broad Market Status Quo
So I spend a few days away to take care of some family matters and totally disconnect myself from the market, only to come back to turn on my Bloomberg to see that not much has changed. Yes there is still plenty of optimistic posturing coming out of the talking heads in Europe but basically its the same Greek-Spanish-German stew lacking flavor and substance.
Anyway, I see the S&P futures continued to rally off its 200day moving average and has now rallied up to its 50day moving average. But there are a few things that still keep me on the defensive for a further advance. For now those concerns remain lack of UP volume, lack of participation from the European leader as represented by the DAX (which is close to reclaiming its 200day moving average but has yet to do so), and a lack of participation from the big risk-on trade as represented by the Shanghai Composite. If those 3 components change for the positive and we can see an upturn in a key broad market oscillator then a meaningful advance can occur. Until then buyer beware.

Anyway, I see the S&P futures continued to rally off its 200day moving average and has now rallied up to its 50day moving average. But there are a few things that still keep me on the defensive for a further advance. For now those concerns remain lack of UP volume, lack of participation from the European leader as represented by the DAX (which is close to reclaiming its 200day moving average but has yet to do so), and a lack of participation from the big risk-on trade as represented by the Shanghai Composite. If those 3 components change for the positive and we can see an upturn in a key broad market oscillator then a meaningful advance can occur. Until then buyer beware.

Friday, June 8, 2012
Shanghai Composite - Uh Oh!
Quick note here...
If China cuts rates and their Shanghai Composite Index doesnt rally then there is definitely something wrong. The 200day remains THE big line in the sand to reverse the weakness. Until then its sell the rallies and look for lower prices.
Have a great weekend!

If China cuts rates and their Shanghai Composite Index doesnt rally then there is definitely something wrong. The 200day remains THE big line in the sand to reverse the weakness. Until then its sell the rallies and look for lower prices.
Have a great weekend!

Thursday, June 7, 2012
Todays Sell-off - the telegraph
In my opinion, todays broad market weakness was given away early by the canary in the coal mine - financials. If you look at intraday charts of any of the major banks - JPM C WFC BAC - they all look like the XLF chart below. A gap up opening (for the 2nd day in a row) and an early reversal on very heavy volume. Once this was in place it was time to short the broad market - SPY, financials, etc - and ride it lower, always keeping new highs as an ultimate stop area or a trailing stop as price collapsed.
Another psychological sign that a gap up today should have been faded was the "hope" trade - that The Bernank would say something enlightening about QE3. But as most of us know the saying "buy the rumor sell the news" selling the gap up opening in anticipation of that hope waning into the meeting and for the rest of the day was as good as selling "the news" to me. And if it didn't work out a tight stop just over the opening highs would have been the way to protect yourself.
Always, repeat ALWAYS, have your stop level known before you put on a trade...and NEVER adjust your stop to a worse (more money losing) price. When you're wrong you're wrong and its best just to admit it as soon as possible and move on.
Anyway, this weakness was telegraphed by the above...tomorrow is another story. Given the late day trashing I would expect a continuation in the same direction - that is, lower. As for areas of interest for the buyers to step in, take a look at 38% and 61% Fibonacci retracement levels on whatever stocks, ETFs, or indices you are interested in.

Tuesday, June 5, 2012
SPY - longer term has more to go on the downside
Somewhat like the last post about the prospects of AAPL's intermediate to longer term weakness as outlined by its weekly chart, below is a weekly chart of SPY painting a similar picture. Although the short term is somewhat oversold and the action this week is giving the bulls some cajones, the intermediate term view doesn't look so promising.
As you can see from the weekly chart below, similar scenarios occurred in the summer of 2010 and summer of 2011. As SPY approached its 50week moving average the oscillator on the bottom was just beginning its fall below the red horizontal line. From there SPY was able to bounce a little in 2010 and a little more in 2011 before ultimately going back below the 50week moving average and recovering when the oscillator went below the green horizontal line.
Currently the 50week moving average is again coming into play, and like 2010 and 2011, the oscillator is just starting to fall below the horizontal red line. What should unfold over the next 6-10 weeks or so is some bounce activity no higher than the 135 area on a weekly closing basis and a further battle around the 50week moving average. The SPY will likely fall further towards the 120 area but the real call on when the bottom will be put in place is when the oscillator is below the green line and especially when it starts to turn up. That will be weeks from now and hopefully I will be revisiting with a more upbeat post. Until then, it looks like sell the rallies will continue to be the way to go.
(NOTE: s&p futures/eminis wasn't used because you get a cleaner long term weekly picture with the SPY. SPX can be substituted for this analysis if you are looking for approximate levels in the index...or you can email me/comment here and I will address it).

Monday, June 4, 2012
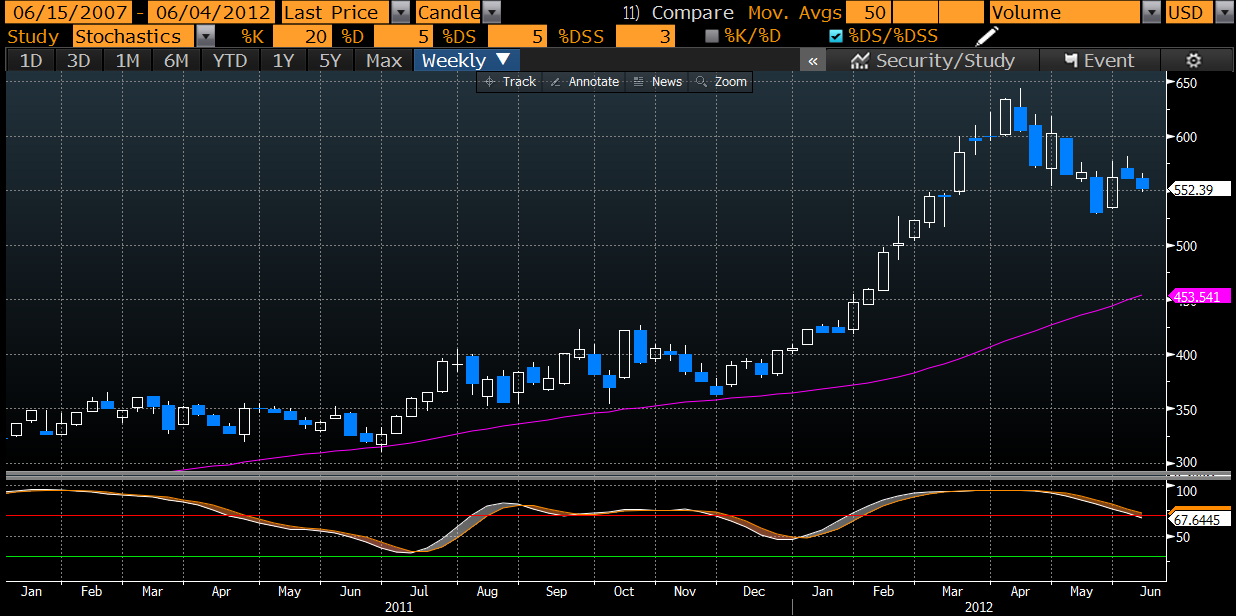
AAPL: follow up
In the last post I highlighted with a tick chart how, for short term (intraday or daily swing ) traders, setups are often apparent when you can dissect a chart to find levels of support and resistance. The last chart showed how previous support can often become resistance - and vice versa.
But although AAPL may have some bounce potential in the short term that traders can take advantage of, it has yet to put in a sustainable longer term bottom as shown in the weekly chart below from the beginning of 2011. As you can see from the oscillator on the lower portion of this chart there was a cross up in July 2011 2-3 weeks after the stock bottomed at its 50week moving average. Then again this past Dec/Jan there was a cross up from a higher level also shortly after the stock bounced off the same moving average. Currently the stock is still far away from its 50week moving average and the oscillator is descending - not even close to turning up.
Anyone looking to buy AAPL for a short term trade may do well if oversold conditions in the broad market as well as some single stocks reverse. But for anyone looking for a long term investment, it appears AAPL is not yet ready to resume its long term trend higher. When it is ready some signals, like a turn up from a lower level in the oscillator below, will give us a clue.
Friday, June 1, 2012
AAPL: how support becomes resistance
Taking a look at a 30day intraday chart of AAPL for the month of May and we can see how support from early in the month near $580 has become resistance at the end of the month. Those same longs who thought the stock wasn't going to break $580 and were buying there likely got out before it fell 10% to $530 but this level still represents formidable resistance for the short term...so keep an eye on the action for hints at direction.
Technically its difficult to figure out if AAPL is carving out an inverse head and shoulders that, when broken, will lead to a $50 extension to the upside, or if the stock is in a high wedge that is sucking in new longs that will bail in force if the stock falls below $560 and drive the stock back to its mid May lows or lower. The jury is still out on that one but probably not for long. Either way AAPL presents many intraday trading opportunities, or longer swing trade setups, if you just know where to look.

Technically its difficult to figure out if AAPL is carving out an inverse head and shoulders that, when broken, will lead to a $50 extension to the upside, or if the stock is in a high wedge that is sucking in new longs that will bail in force if the stock falls below $560 and drive the stock back to its mid May lows or lower. The jury is still out on that one but probably not for long. Either way AAPL presents many intraday trading opportunities, or longer swing trade setups, if you just know where to look.

Subscribe to:
Posts (Atom)