Tuesday, September 11, 2012

Natural Gas looking good

In addition to moving over all 3 of its major moving averages in the past 6 months, natural gas has made a series of higher lows since bottoming in April of this year. Additionally, it moved over its 200day moving average today with a short term oscillator moving higher from an oversold condition. If price can sustain itself over the 200day for a few days, it has a chance of moving significantly higher towards 3.50.

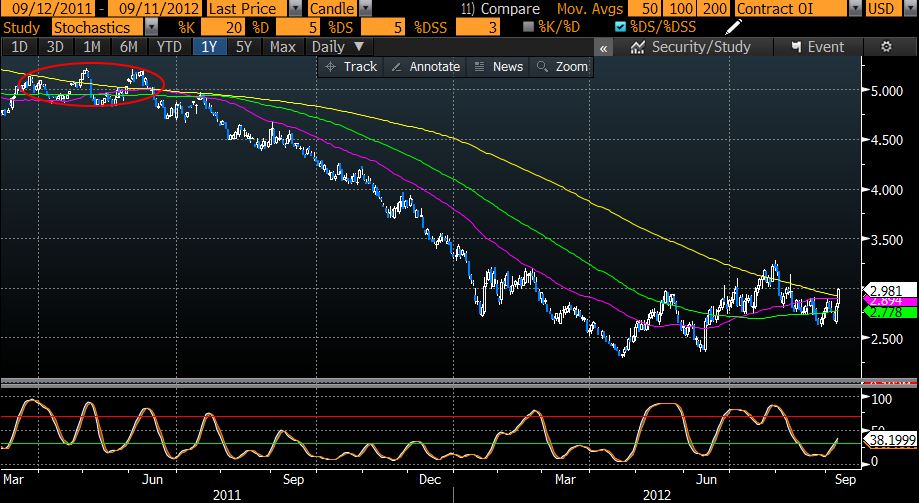
The big caveat is that natural gas has been in a strong bear trend for some time, and the last time it acted similarly with moving over all 3 of its major moving averages after a sustained downturn (see red highlighted area), price eventually failed to improve and another downtrend ensued. All buy signals should come with a warning sign...but given the flammable nature of natural gas, this one should come with an exclamation point!
Along with the strength in natural gas comes strength in natural gas stocks...watch high short interest stocks prepared to move or already moving over a major moving average on above average volume for squeeze/extensions.
 

Monday, September 10, 2012

Impressive week for the Shanghai Composite

By any technical measure, China has been in a bearish trend for a while. But last week the Shanghai Composite Index (SHCOMP) put an impressive bullish engulfing candle on the board for the first time in a while. The last time was in June 2011 - only a 3% gain following but it did not come after an extended downturn. Prior to that was in July 2010 which did come after an extended downturn and led to a +20% gain in 4 months.
If the strength seen from last week can hold, look for an extension towards the 2200 area and bearish trendline connecting peaks from 2011. Above that would be near 2450 then the more formidable 2600 level  which is former support turned resistance from 2010 and 2011.
If the recent strength does NOT hold and the recent lows near 2000 are taken out, then look for a continuation of what has been a long multi-year bear market in China. 2012 is the Year of the Dragon in Chinese astrology, but I wonder if they have a sign for the decade? If so, then this may be the Decade of the Bear.

Tuesday, September 4, 2012

August was an interesting month on many fronts (the EUR, China, deteriorating internals, etc), but one in particular that stands out to me is the outperformance of small caps vs large caps domestically. This we can see in the ratio chart below of IWM vs SPY.

For the month, small caps outperformed large caps by almost 3%. Although you may not think 3% is  significant, it does show a more "risk-on" or "performance-chasing"  approach and this may help equities overall as we head into the beginning of a new month which is typically bullish.
This relative outperformance of small caps to large caps has happened before, most recently in June/July, but these moves have been counter-trend as the overall trend is down/bearish. So this may be another short term push - watch for it to end soon after the beginning of the month inflows...