IBM MSFT MCD GOOG CMG and others...poor earnings / guidance
are all signs of the beginning of a topping process. Big volume in these names
on the selloff action also. I mentioned this in Monday's post so please BEWARE!
Friday, October 19, 2012
Wednesday, October 17, 2012
Citi (symbol: C) watching closely
Citi is looking frothy up here as it taps its highs near $38
from March earlier this year. A few interesting things about the current stock
price and why it feels poised to pull back 10% or so.
*The volume spike highlighted on the lower volume chart is very similar to the volume spike that preceded the March top.

*The last time when Citi was this far above its 200day sma
(approx 20%) the stock fell back to its 200day sma within 6 weeks, before
falling significantly below.
*The first attempts at a double top usually fail...thats WHY
they call them double tops.*The volume spike highlighted on the lower volume chart is very similar to the volume spike that preceded the March top.
Watch todays action (as well as action in the next few days)
for a potential Evening Star, Abandoned Baby Top or Doji candlestick formation
as a sign for a reversal. Support on the way down starts near $36, then more formidable
short term support near $34.

Tuesday, October 16, 2012
Place your bets...LVS & WYNN
LVS and WYNN are both poised to run here...especially after
the strong performance of the broad market yesterday and this morning
pre-opening. Yesterday WYNN closed over its high close of $115.69 from 9/19 and
should soon push to $120+ while LVS has been acting well the past few days as
the 50day sma is crossing over the 100day sma as the stock sits on the $45
pivot. A high volume push over sets up the stock for an extension back towards
$48.
Monday, October 15, 2012
Todays potpourri: Falling behind...an AAPL a day...internal bleeding.
Wow, I didnt realize I havnt posted anything in a month. I've been very busy with personal issues but THAT is ridiculous. There have been some great swing trade opportunities recently, especially in the coal space - I will try my best to post more.
Until then, just looking at the last 2 posts from September it seems the SHCOMP is still struggling slightly below the level mentioned last month. On a short term basis is has made some improvements but for the longer term, although improving, it still has some work to do.
As for the Nat Gas call, that was spot on. Nat gas rallied hard (some 20%+ from my mention) and pulled a lot of sector stocks with it as well as helping the coal stocks rally as people think more about the industry switching form more expensive gas to cheaper coal. Can you say "pair trade"?
As an aside, from what I can tell about the recent action AAPL has found some serious institutional selling. Even on days when the broad market is rallying this stock is struggling to hold on. Watch major moving averages as inflection points - the stock recently fell hard after breaking its 50day sma, and similar to the last time it did this, it fell straight to its 100day sma where it is close to now. If institutional money doesnt start flowing back in, look for further price pressure. This is a favorite of mine and many others to trade short term and there are constantly multiple short term swings to play on both the upside and downside.
As the internals of the broad market continue to deteriorate it is important for short term traders to stay thin and nimble. Swing trading opportunities (a few days to a few weeks in duration) are plentiful but use tight stops. When (not if) we get the first big down day - something that may not happen until after the election - that will likely be the sign of THE top and further downside will be highly probable. Until then, light volume selloffs or pullbacks to previous support areas are likely to be bought. A big distribution day on above average volume will be the canary in the coal mine for me. This is no time for the light volume and anemic action to put you to sleep...be aware and read the signs.
Tuesday, September 11, 2012
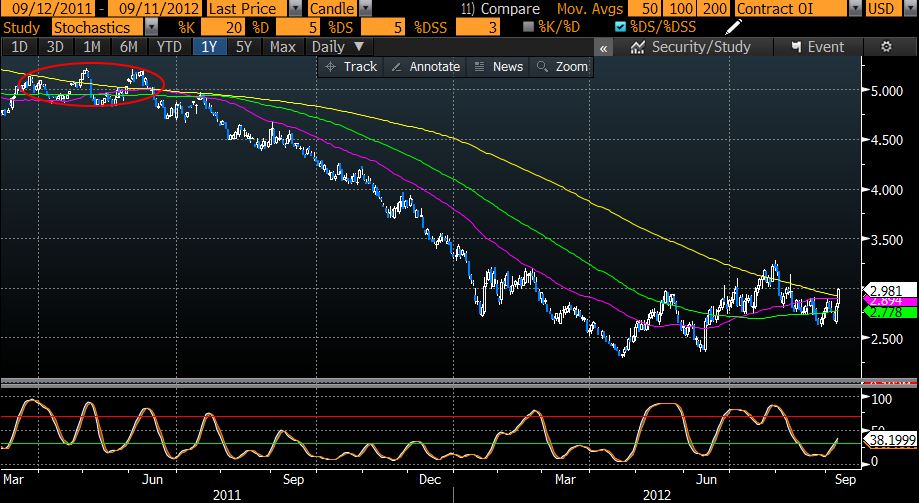
Natural Gas looking good
In addition to moving over all 3 of its major moving
averages in the past 6 months, natural gas has made a series of higher lows
since bottoming in April of this year. Additionally, it moved over its 200day
moving average today with a short term oscillator moving higher from an
oversold condition. If price can sustain itself over the 200day for a few days,
it has a chance of moving significantly higher towards 3.50.
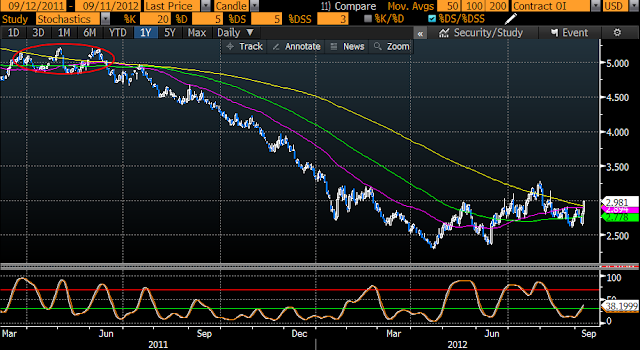
The big caveat is that natural gas has been in a strong bear
trend for some time, and the last time it acted similarly with moving over all
3 of its major moving averages after a sustained downturn (see red highlighted
area), price eventually failed to improve and another downtrend ensued. All buy
signals should come with a warning sign...but given the flammable nature of
natural gas, this one should come with an exclamation point!
Along with the strength in natural gas comes strength in
natural gas stocks...watch high short interest stocks prepared to move or
already moving over a major moving average on above average volume for squeeze/extensions.
Monday, September 10, 2012
Impressive week for the Shanghai Composite
By any technical measure, China has been in a bearish trend
for a while. But last week the Shanghai Composite Index (SHCOMP) put an
impressive bullish engulfing candle on the board for the first time in a while.
The last time was in June 2011 - only a 3% gain following but it did not come
after an extended downturn. Prior to that was in July 2010 which did come after
an extended downturn and led to a +20% gain in 4 months.

If the strength seen from last week can hold, look for an
extension towards the 2200 area and bearish trendline connecting peaks from
2011. Above that would be near 2450 then the more formidable 2600 level which is former support turned resistance
from 2010 and 2011.
If the recent strength does NOT hold and the recent lows
near 2000 are taken out, then look for a continuation of what has been a long multi-year
bear market in China. 2012 is the Year of the Dragon in Chinese astrology, but
I wonder if they have a sign for the decade? If so, then this may be the Decade
of the Bear.

Tuesday, September 4, 2012
August was an interesting month on many fronts (the EUR,
China, deteriorating internals, etc), but one in particular that stands out to
me is the outperformance of small caps vs large caps domestically. This we can
see in the ratio chart below of IWM vs SPY.

For the month, small caps outperformed large caps by almost
3%. Although you may not think 3% is significant,
it does show a more "risk-on" or "performance-chasing" approach and this may help equities overall as
we head into the beginning of a new month which is typically bullish.
This relative outperformance of small caps to large caps has
happened before, most recently in June/July, but these moves have been
counter-trend as the overall trend is down/bearish. So this may be another
short term push - watch for it to end soon after the beginning of the month
inflows...

Subscribe to:
Posts (Atom)