Sunday, June 17, 2012

Broad Market Status Quo

So I spend a few days away to take care of some family matters and totally disconnect myself from the market, only to come back to turn on my Bloomberg to see that not much has changed. Yes there is still plenty of optimistic posturing coming out of the talking heads in Europe but basically its the same Greek-Spanish-German stew lacking flavor and substance.

Anyway, I see the S&P futures continued to rally off its 200day moving average and has now rallied up to its 50day moving average. But there are a few things that still keep me on the defensive for a further advance. For now those concerns remain lack of UP volume, lack of participation from the European leader as represented by the DAX (which is close to reclaiming its 200day moving average but has yet to do so), and a lack of participation from the big risk-on trade as represented by the Shanghai Composite. If those 3 components change for the positive and we can see an upturn in a key broad market oscillator then a meaningful advance can occur. Until then buyer beware.


Friday, June 8, 2012

Shanghai Composite - Uh Oh!

Quick note here...

If China cuts rates and their Shanghai Composite Index doesnt rally then there is definitely something wrong. The 200day remains THE big line in the sand to reverse the weakness. Until then its sell the rallies and look for lower prices.

Have a great weekend!

Thursday, June 7, 2012

Todays Sell-off - the telegraph

In my opinion, todays broad market weakness was given away early by the canary in the coal mine - financials. If you look at intraday charts of any of the major banks - JPM C WFC BAC - they all look like the XLF chart below. A gap up opening (for the 2nd day in a row) and an early reversal on very heavy volume. Once this was in place it was time to short the broad market - SPY, financials, etc - and ride it lower, always keeping new highs as an ultimate stop area or a trailing stop as price collapsed.

Another psychological sign that a gap up today should have been faded was the "hope" trade - that The Bernank would say something enlightening about QE3. But as most of us know the saying "buy the rumor sell the news" selling the gap up opening in anticipation of that hope waning into the meeting and for the rest of the day was as good as selling "the news" to me. And if it didn't work out a tight stop just over the opening highs would have been the way to protect yourself.

Always, repeat ALWAYS, have your stop level known before you put on a trade...and NEVER adjust your stop to a worse (more money losing) price. When you're wrong you're wrong and its best just to admit it as soon as possible and move on.

Anyway, this weakness was telegraphed by the above...tomorrow is another story. Given the late day trashing I would expect a continuation in the same direction - that is, lower. As for areas of interest for the buyers to step in, take a look at 38% and 61% Fibonacci retracement levels on whatever stocks, ETFs, or indices you are interested in.


Tuesday, June 5, 2012

SPY - longer term has more to go on the downside


Somewhat like the last post about the prospects of AAPL's intermediate to longer term weakness as outlined by its weekly chart, below is a weekly chart of SPY painting a similar picture. Although the short term is somewhat oversold and the action this week is giving the bulls some cajones, the intermediate term view doesn't look so promising.

As you can see from the weekly chart below, similar scenarios occurred in the summer of 2010 and summer of 2011. As SPY approached its 50week moving average the oscillator on the bottom was just beginning its fall below the red horizontal line. From there SPY was able to bounce a little in 2010 and a little more in 2011 before ultimately going back below the 50week moving average and recovering when the oscillator went below the green horizontal line.

Currently the 50week moving average is again coming into play, and like 2010 and 2011, the oscillator is just starting to fall below the horizontal red line. What should unfold over the next 6-10 weeks or so is some bounce activity no higher than the 135 area on a weekly closing basis and a further battle around the 50week moving average. The SPY will likely fall further towards the 120 area but the real call on when the bottom will be put in place is when the oscillator is below the green line and especially when it starts to turn up. That will be weeks from now and hopefully I will be revisiting with a more upbeat post. Until then, it looks like sell the rallies will continue to be the way to go.

(NOTE: s&p futures/eminis wasn't used because you get a cleaner long term weekly picture with the SPY. SPX can be substituted for this analysis if you are looking for approximate levels in the index...or you can email me/comment here and I will address it).


Monday, June 4, 2012

AAPL: follow up

In the last post I highlighted with a tick chart how, for short term (intraday or daily swing ) traders, setups are often apparent when you can dissect a chart to find levels of support and resistance. The last chart showed how previous support can often become resistance - and vice versa.

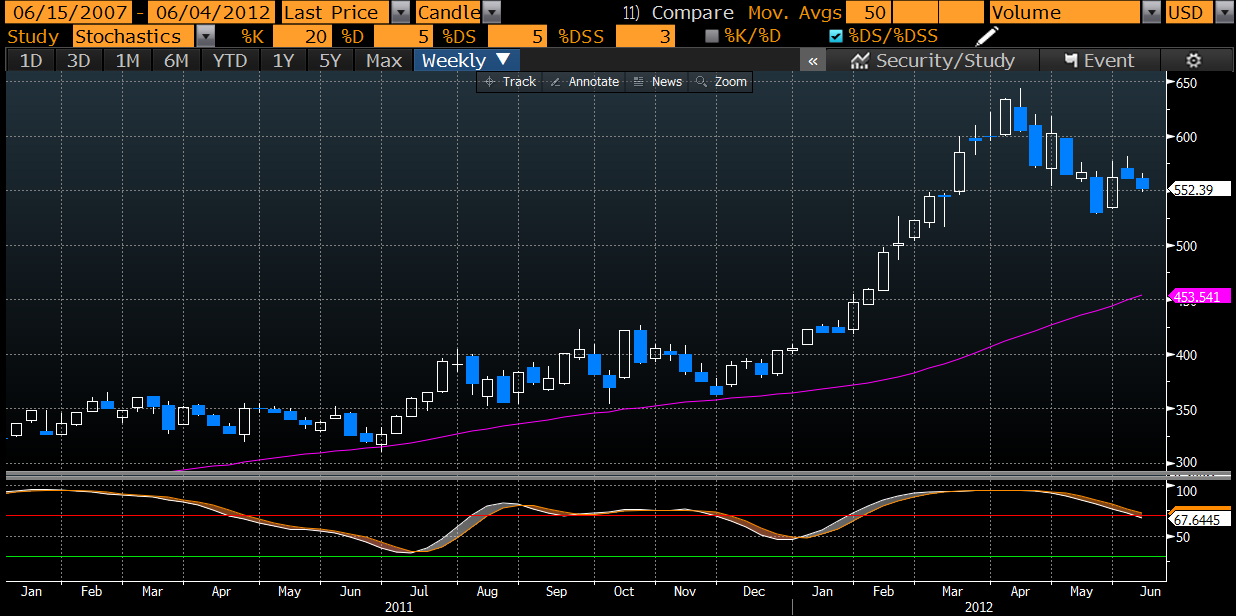
But although AAPL may have some bounce potential in the short term that traders can take advantage of, it has yet to put in a sustainable longer term bottom as shown in the weekly chart below from the beginning of 2011. As you can see from the oscillator on the lower portion of this chart there was a cross up in July 2011 2-3 weeks after the stock bottomed at its 50week moving average. Then again this past Dec/Jan there was a cross up from a higher level also shortly after the stock bounced off the same moving average. Currently the stock is still far away from its 50week moving average and the oscillator is descending - not even close to turning up.

Anyone looking to buy AAPL for a short term trade may do well if oversold conditions in the broad market as well as some single stocks reverse. But for anyone looking for a long term investment, it appears AAPL is not yet ready to resume its long term trend higher. When it is ready some signals, like a turn up from a lower level in the oscillator below, will give us a clue.


Friday, June 1, 2012

AAPL: how support becomes resistance

Taking a look at a 30day intraday chart of AAPL for the month of May and we can see how support from early in the month near $580 has become resistance at the end of the month. Those same longs who thought the stock wasn't going to break $580 and were buying there likely got out before it fell 10% to $530 but this level still represents formidable resistance for the short term...so keep an eye on the action for hints at direction.

Technically its difficult to figure out if AAPL is carving out an inverse head and shoulders that, when broken, will lead to a $50 extension to the upside, or if the stock is in a high wedge that is sucking in new longs that will bail in force if the stock falls below $560 and drive the stock back to its mid May lows or lower. The jury is still out on that one but probably not for long. Either way AAPL presents many intraday trading opportunities, or longer swing trade setups, if you just know where to look.


Thursday, May 31, 2012

CAT: looking for a possible repeat of 2008.

There are some similarities in CAT to the present time and what happened in 2008 that I want to point out. This stock looks ready for a sharp fall and patient traders may be able to take advantage of this, especially if price sensitive.

*As you can see by the large green dashed line below, in 2007/2008 CAT made a large double top just like it did in the 2011/2012 period.
*Then, after breaking below its 200day moving average (yellow line) it wasn't long before the 50day moving average crossed below the 100day moving average as highlighted by the red circle.
*Lastly, the stock consolidated sideways below its 200day moving average for approximately 3 months (as in the red box) before falling aggressively in the meltdown of 2008.

It seems to me that CAT is setting up for another fall, although probably not as severe as the beating it took in 2008. This consolidation below the 200day moving average is sucking in longs that believe the stock is oversold and or undervalued. I think action this presents a good opportunity to play the stock from the short side anywhere from here near $90 up to the 200day moving average near $96. That gives the patient short seller (or put buyer) enough wiggle room to look for good prices on weak bounces. Additionally, aggressive traders can also short if the stock makes a new lower low below the bottom of the red box.

Anyone who plays this stock for a fall will likely use a high volume close over the 200day moving average as a prudent stop. Always know your risk BEFORE you enter a trade. On the downside I would look at the $80 area for some serious short covering and bottom fishing although in a broad market selloff this level will only be a temporary pause on the way to much lower prices. Overall I cannot see the stock falling  below $60 unless there was a global equity meltdown.

With the weak bounce in the broad market looking fragile, I will be looking at CAT as well as other large caps (consider F, GM, as well as XLE XHB XOP GDX and their components) to play from the short side. Yes we did see a stochastics buy signal recently that may lead to slightly higher prices as we climb a wall of worry but without volume that will soon come to an end. Overall the intermediate trend has over the past number of weeks proven itself to be down and thats the way it needs to be traded.