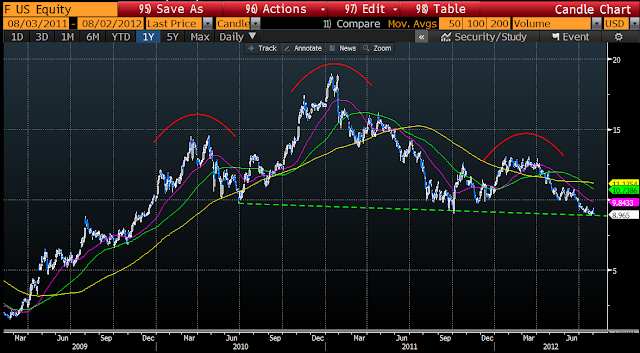
There are 2 ways to view at the technical weakness. Either 1) as a large head and shoulders as
outlined by the red arcs. This is the worst of the 2 views as a measured move
from a break below the neckline would take the stock to near 0. Not highly
likely. Another way to view the technical weakness is 2) a somewhat descending
triangle (not textbook because the base is declining and not horizontal). This
view would have a minimum measured move of approximately $4 lower to $5 on a
definitive break of trendline support near $8.80.
The only thing that would negate the negative look in F is
if the stock can regain the $10 area and much more importantly the descending
trendline currently near its 200day moving average near $11. That would likely
get the stock moving back up nicely. But if that does not happen, and the stock
does break below $8.80 on a pickup in volume, then look for a move to much
lower levels.

No comments:
Post a Comment