Wednesday, July 11, 2012

PVH...standing on the precipice

As the broad market continues to act shaky there will be an increase in the number of stocks that break technical support...some well defined areas like major moving averages (as in this post from IBM yesterday) while others may be less textbook.

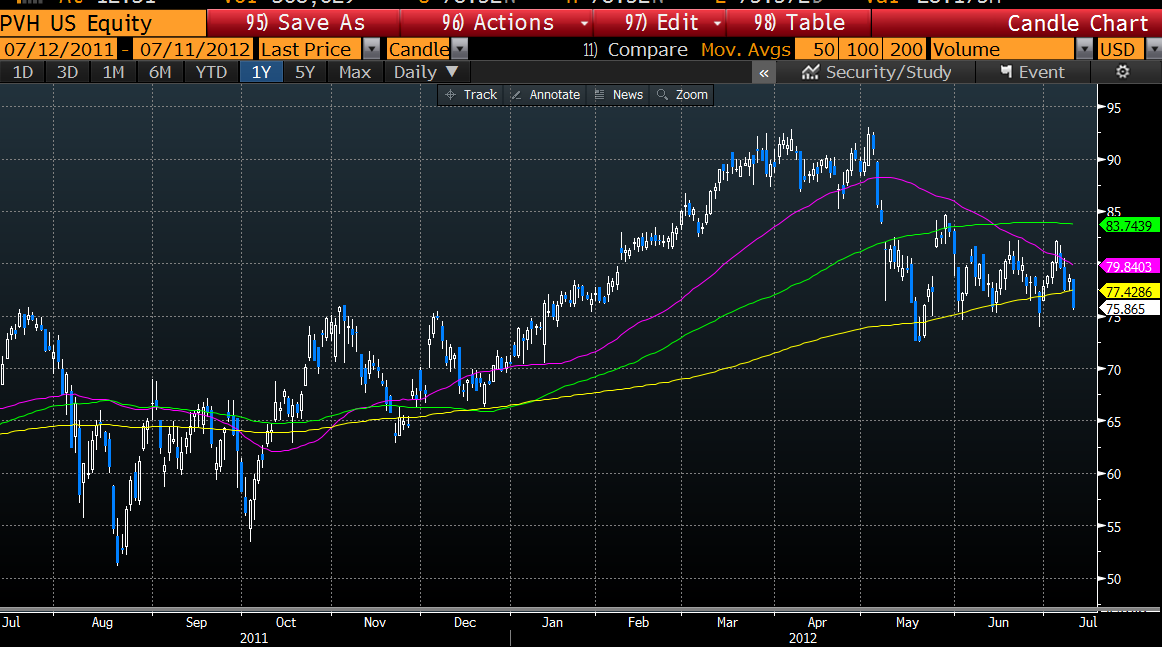
One such example that jumped onto my radar today was PVH. The stock has been flirting with its 200day moving average since May and continues to be in a bear flag. Although the 200day has been successfully defended so far with breaches below not lasting for more than 2 days, this type of activity needs to be monitored closely - especially since this is in a discretionary sector. A high volume close below, especially if sustained for more than 2 days, will likely lead to much lower prices. Look for first support to be ~$70 with much stronger support ~$65.
Tuesday, July 10, 2012

IBM below its 200day...

With IBM below its 200day moving average watch out. Although this stock has been below its 200day recently, as well as las summer (yes both were headfakes) this time looks different as the stock has been in a strong downtrend since its April peak.

Watch previous support around $180 as its first real test.


Monday, July 9, 2012

IWM outperforming S&P on relative basis

Although I am not a big fan of the overall market at this juncture the chart below is impressive. Its is a relative performance chart of small caps (IWM) vs the broad market (SPY). As you can see IWM has outperformed SPY by over 4% since mid June. Despite deteriorating conditions in Europe and China, this is encouraging for the bulls.

Will be interesting to see if this continues in teh near future or if its just a short term blip.

Friday, July 6, 2012

Bad jobs number...S&P heading lower


Not a very friendly employment number. The S&P futures reacted strongly to that disappointment and today could turn into a trend down day, especially with the futures back below the 100day moving average of 1357. Watch that level as an inflection point.

Also, dont forget the EURO...its on the slippery slope to 1.20. As a reference, the last time it was there was June 2010 when the S&P was trading near 1,000...Food for thought!

Enjoy your weekend.

Thursday, July 5, 2012

EURO - uh oh.....

This is not a pretty picture. The EURO is now under 1.25 and not looking at support until the 1.20 area.

This is important.

This is meaningful.

This needs to be given your full attention.


Tuesday, July 3, 2012

AAPL...making higher highs

A few posts ago (actually here: APPL's curves don't look so great) I wrote about how the rounding top in AAPL is looking quite daunting and a fall below the 100day moving average will lead to much lower prices. I also mentioned that the only thing that would change my mind about that technical drop would be for the stock to make a higher high over its June highs.

Well yesterday AAPL did just that...made a higher high over $591.

This should lead to an extension to the upside - but watch for this price to act as an important pivot point in the next few days if the stock happens to not explode higher from here. Although the stock did make a higher high, its real test will come if price can hold over that important mark in the next few days. If so, then the AAPL gravy train should make many holders very very happy in the weeks and months ahead...but if not, and the stock were to fall back below $591 on heavy volume and more importantly below its 100day moving average, then the fall to previously mentioned levels will likely be near.

Monday, July 2, 2012

HOG - This Harley is starting to sputter


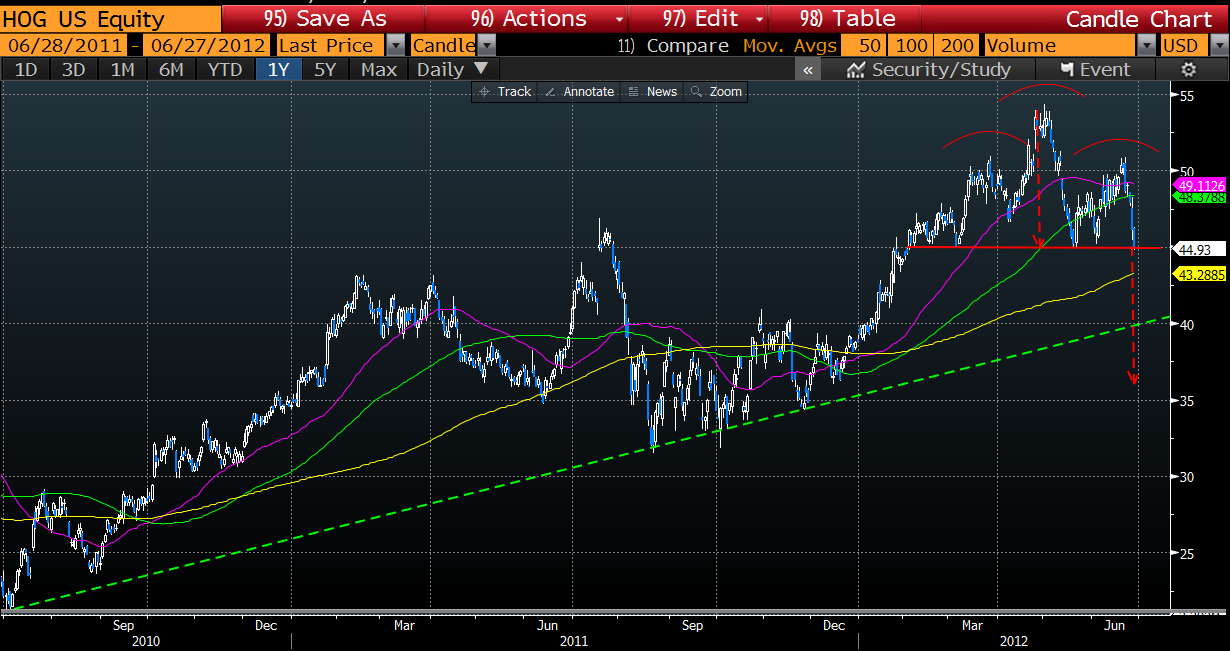
It was with this post on May 20th that I mentioned the long term bullish trendline in HOG as a very good place to step in on HOG in case the stock collapsed. That line is represented below by the green dashed line. But since then, there has been a large Head & Shoulders that is well defined with an imminent break of the neckline coming (even though this chart is from a few days ago it is still valid).


So what happens on a high volume neckline break down? A measured move below the neckline equal to the distance of the red arrow. There will be pauses along the way down like the 200day moving average and below that at the long term bullish trend line where bulls may defend vehemently - after all the stock is in a primary long term bull trend. But if it collapses, a completion of the measured move could take the stock all the way down towards the $35 area if shorts pile on and longs really get nervous about HOGs prospects in a slowing economy.
Something to consider if you are long or looking for a high probability technical setup for short exposure. Any other traders who are looking at this same setup and are playing it will use stops according to their risk tolerance...likely somewhere a little above the neckline.