HAPPY NEW YEAR ALL!
THANK YOU FOR FOLLOWING.
Monday, December 31, 2012
Thursday, December 27, 2012
Time to be careful!!!
President Obama comes back early from holiday and everyone
"hopes" this means a deal is imminent. But the market is a
psychological machine that currently has all this euphoria adding up to
+3handles yesterday morning and -5handles on the day…because of that news? The
early morning strength just didn’t add
up if youre not wearing the christmas-rose colored glasses.
Technically the broad market suffered some real damage last week. Friday 12/21 was the heaviest volume selloff in the SPY since the reversal bottom on 11/16. High volume is typically a sign of a reversal especially after a strong selloff (sep 14th to nov 16th selloff was 8%) or after a strong rally (nov 16th to dec 18th rally was ~8%). My take, looking through monetarily or psychologically unbiased glasses, is that the broad market is in trouble. Anyone in this business for a while knows the "hope" trade never works and reality is what you see...not what you think.
Having said all that on the day after christmas (sorry to be such a scrooge) it is clear to see i am leaning very bearish. The announcement of a fiscal cliff deal, in my view, will be one of the biggest "sell the news" events of the year. On the way down, 1400 will be good psychological support and the first battleground followed by 1370/80 and then the area surrounding the November lows near 1340/50. The only thing that will change that view is a high volume broad market rally over the September highs of 1452.

Thursday, December 20, 2012
Gun makers oversold rally
Since the elementary school massacre in Newtown, CT gun makers (RGR and SWHC) and sellers (CAB and DKS) have been getting smoked. Actually, starting a little before the shootings the stocks were under pressure and then those horrible events accelerated the selling pressure. But when stocks get hit for 30% in a very short period of time there is often a relief rally...and the action yesterday in the names mentioned above are doing just that.
As you know I believe the best way to play a stock is in the
direction of its trend - and these trends are to the downside. So if you want
to play for a countertrend bounce which may reap some nice percentage gains, I
would suggest you be careful and be out on sharp moves. But if you are looking
for a bigger swing trade move and not just a scalp, then look for areas of
overhead resistance (like $9-9.50 SWHC, $45, then $46-47 RGR) to play from the
short side. (CAB and DKS may also fit this scenario but I believe pure gun
makers will be hurt much more than sellers because CAB and DKS have so many
other products in their revenue mix).
Ultimately SWHC may go to $6 and RGR may see $35 or as low
as $30. Stops above according to your risk tolerance.
Tuesday, December 18, 2012
T - looking iffy at these levels.
Like a lot of high dividend paying stocks and closed-end
funds, AT&T is just not acting well these days. Its relative
underperformance to many other stocks and its benchmark has been very
apparent recently as the stock continues to struggle below its 200 day moving
average. Needless to say, this type of underperformance should put it on traders short radar.
The bear flag just below the 200day moving average looks
very similar to the bear flag below its 200day during the summer of 2011. Back
then, the stock failed after a headfake close over the 200day and fell a quick
10% before recovering. The action since the October high seems very similar.
The stock got hit hard off its highs and fell right to its 200day. Now its in a
bear flag just below the 200day as the 50day comes down to cross the 200day...any day now.
Aggressive traders may want to enter a short here and look
to cover near or below $32. Although I am looking for a repeat of the action
from 2011 into year end, watch volume and price for hints of a change in
direction as a close over its most recent closing high near $34.75 will get it
moving higher again.

Monday, December 17, 2012
Watching X...
Watch US Steel this week. Moves like that from friday usually
have follow thru...especially for stocks that have a high 25% short interest .
(chart from fridays close).
I would expect the stock to move to $25 in the near term,
possibly higher. Any light volume pullback towards its 200day moving average
should be monitored closely. If it holds then that would be a good sign for an
extension...if not, use that as a sell stop and get out.

Wednesday, December 12, 2012
S&P 500 most Overbought / Oversold
Bespoke has a list of the most overbought and oversold stocks in the S&P 500 that i thought would be worth reposting HERE or here http://www.bespokeinvest.com/thinkbig/2012/12/12/most-overbought-and-oversold-sp-500-stocks.html
Note that tech stocks make up 9 of the top 20 stocks that are overbought. This fits into my recent post that Im not feeling the love in XLK.
Note that tech stocks make up 9 of the top 20 stocks that are overbought. This fits into my recent post that Im not feeling the love in XLK.
Tuesday, December 11, 2012
WMT - Christmas season bringing the company some coal?
So many charts look like this WMT chart these days...a
collapse from its October highs to its mid November lows on the 200day moving
average, and now a rally back to its flat/descending 50day and 100day moving averages . This is not necessarily a
"dead-cat" bounce in one of the worlds largegst and most successful
retailers, but it is nearly a textbook example of a high probability short.

Trade premise:
Enter short somewhere between $71.50 - $73 and cover near
the 200day moving average currently near $68.50 (unfortunately I wrote this
midday when the stock was trading near $72 - but the analysis still holds). Those
less averse can start covering near $70 while those more tolerant can cover
some on the 200day moving average and keep some on if the broad market
collapses and WMT follows it lower towards $65. A prudent stop would be over
the 100day moving average currently near $73.25 (or according to your own risk
tolerance).

Monday, December 10, 2012
Micro-cap stock worth watching (FRP)
Fairpoint Communications (Symbol: FRP) is a $205mm microcap company that has
been gaining lots of traction over the past 7+ months. And although a nearly 100% gain over that time should put it on the radar of many, chances are its still not a household name at the local after work (or after internet chatroom) watering hole. "Hey Sally did you see the action in AAPL today? It was horrible." "Yea Steve, your right. But Ive been watching FRP lately instead." ...is a conversation that is probably NOT happening. But that is a good thing. Because sometimes the secret sauce of making money is discovering something before someone else does.
That seems to be the case for FRP. Not many know the name or realize its technical breakout potential. Although there are some large and well known institutional holders of the name, it just doesnt get the play it deserves because of its tiny market cap (and probably some other fancy four letter fundamental terms we wont get into here...like debt).
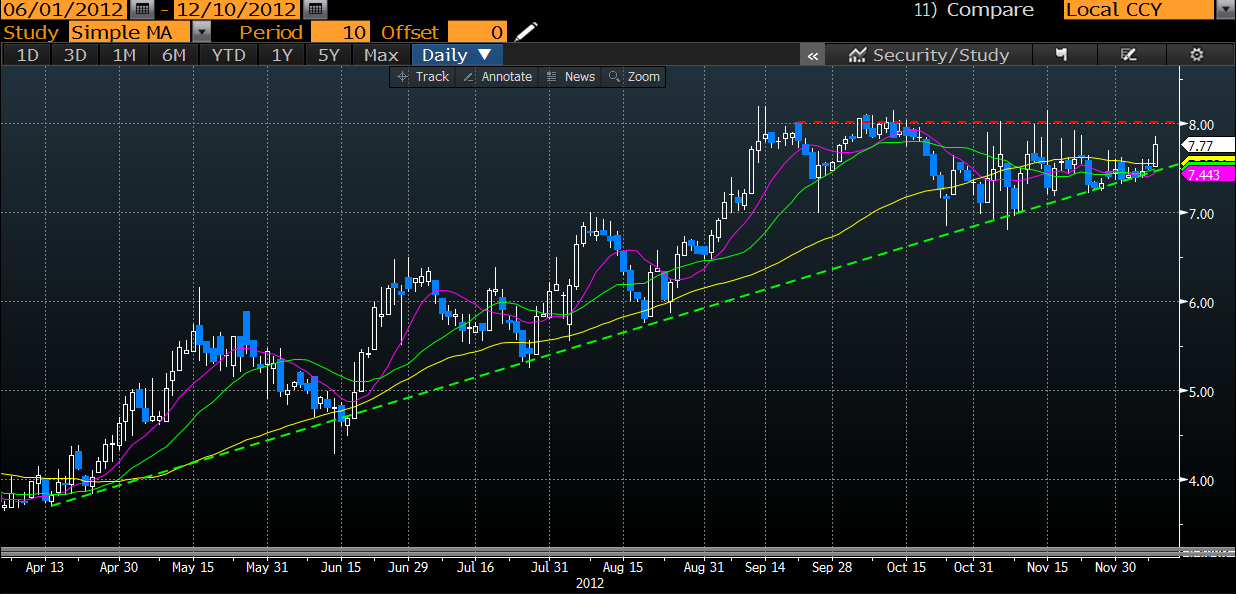
Anyway, here is the short story...the stock has been trading along a steady bullish trendline over the past 7 months where there is CLEARLY consistent buy interest...and someone big enough to not have it broken. That trendline (green dashed line) currently sits near $7.50 and continues to rise. As you can see from the horizontal red line, $8 is the near term resist and the top of a multi-month ascending triangle. An above average volume break over $8 resistance will get the stock moving as institutional buyers get more aggressive and possibly some momentum players jump on the name. This would also get the 18% short interest more involved as they need to assess and manage their risk in this thinly traded stock. Such a close over $8 would get the stock moving at least $1 higher near term, but considering where the stock came from over the past year+, an extension could be much higher towards $10/12 or above.
There are 2 ways to play this one. Either buy it on weakness towards or on its bullish trend line OR buy a high volume break over $8. Sell stops are always according to your own personal risk tolerance and should NEVER be moved lower.
Comments, other input, or agree/disagree arguments are always welcome.
That seems to be the case for FRP. Not many know the name or realize its technical breakout potential. Although there are some large and well known institutional holders of the name, it just doesnt get the play it deserves because of its tiny market cap (and probably some other fancy four letter fundamental terms we wont get into here...like debt).
Anyway, here is the short story...the stock has been trading along a steady bullish trendline over the past 7 months where there is CLEARLY consistent buy interest...and someone big enough to not have it broken. That trendline (green dashed line) currently sits near $7.50 and continues to rise. As you can see from the horizontal red line, $8 is the near term resist and the top of a multi-month ascending triangle. An above average volume break over $8 resistance will get the stock moving as institutional buyers get more aggressive and possibly some momentum players jump on the name. This would also get the 18% short interest more involved as they need to assess and manage their risk in this thinly traded stock. Such a close over $8 would get the stock moving at least $1 higher near term, but considering where the stock came from over the past year+, an extension could be much higher towards $10/12 or above.
There are 2 ways to play this one. Either buy it on weakness towards or on its bullish trend line OR buy a high volume break over $8. Sell stops are always according to your own personal risk tolerance and should NEVER be moved lower.
Comments, other input, or agree/disagree arguments are always welcome.
Tuesday, December 4, 2012
Tech (XLK) - just not feelin the love...
I just cant
get behind tech. I know a lot of people that like it and there are some diehard
believers of companies like CSCO, INTC, MSFT (MSFT recently mentioned as an
excellent shorting opportunity into the Surface release with THIS POST), but it
just doesnt get my bullish juices flowing.

If you want further proof, take a look at the XLK (SPDR Tech
ETF) chart, below. To me, this screams TREND CHANGE!
*Broke below its 1year+ bullish trendline in October
*Below all 3 of its major moving averages and currently struggling
at its 200day sma
*Underperforming the broad market from the September highs on
a relative basis by approximately 5%
*Could be in the
midst of forming the right shoulder of a large Head & Shoulders which, if
true, would lead to much lower prices.
Every cloud has a silver lining and the XLK silver lining is
2 fold...it held its June lows on a mid November test and has bounced strongly
since, and its also below the March
reaction high near $30.50 which on a bounce would not only be a much higher
H&S top, but it would take price back to the underside of the bullish
trendline setting up for a much nicer shorting opportunity.
Having said all that, I believe shorting between $29 -
$29.50 presents a high probability risk/reward opportunity to see price revert
back to the mid to low $27s over the short/intermediate term - approximately $2
lower - while using a tight stop on an above volume close over $30. If the
broad market breaks down hard and XLK fails to holds $27, then a test of its
2011 lows near $23 is highly likely.
Subscribe to:
Posts (Atom)