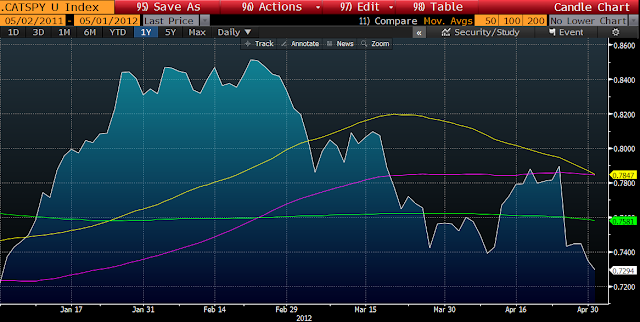
But looking more closely at the recent underperformance and also creating a ratio chart (second chart) to look into its relative performance vs. the SPY, its easier to see that CAT is struggling. Not only is it struggling on an absolute basis having come in from its recent highs to near $100 but it is also struggling on a relative basis vs. the SPY by approximately 14%. Thats big!
So whether CAT is working around some issues in a bullish pattern or a bearish pattern yet to be determined, it is clearly underperforming its peers and would have to be considered as a sell or short given its weakness. Weak volume rallies between here and $110 are likely to fail with a drop towards $90 likely, especially if the broad market weakens. If the broad market strengthens it is possible CAT can regain its footing but watch it on a relative basis as well. If (and thats a big IF) the stock can clear its recent double top on above average volume them it should be off to the races for VERY strong gains. Until then, expect further weakness.
If you have any questions about creating a ratio chart or looking at something on a relative basis don't hesitate to ask.


No comments:
Post a Comment