It was with this post on May 20th that I mentioned the long
term bullish trendline in HOG as a very good place to step in on HOG in case
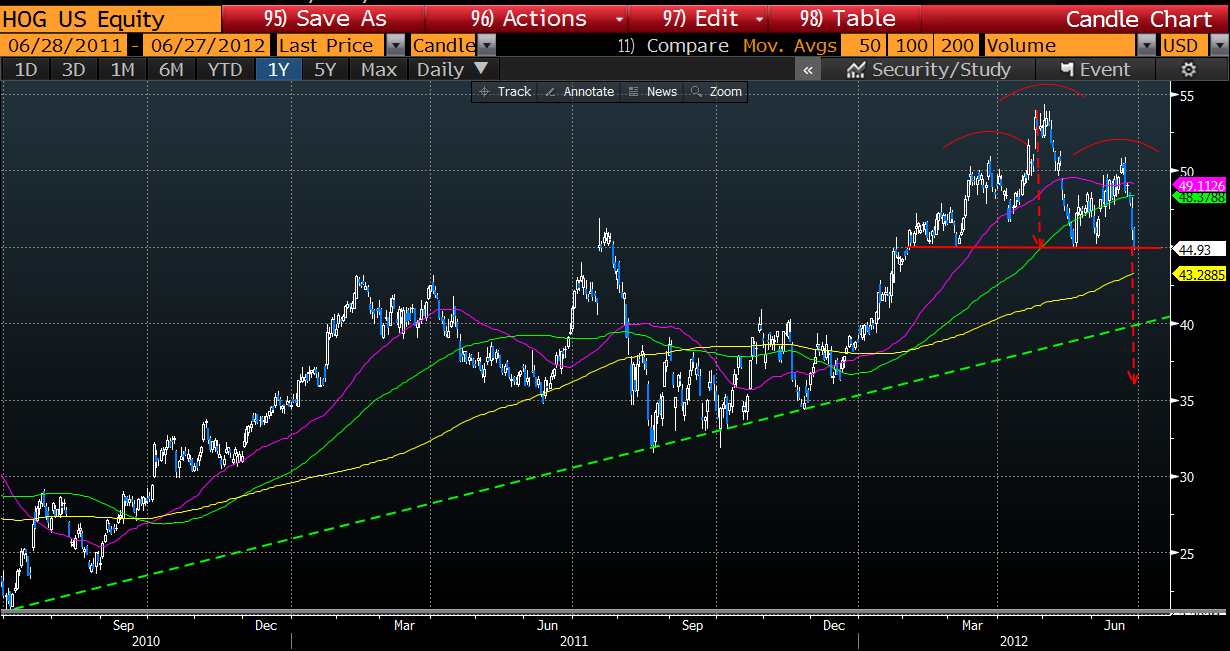
the stock collapsed. That line is represented below by the green dashed line. But since then, there has been a large Head & Shoulders that is well defined with an imminent break of the neckline coming (even though this chart is from a few days ago it is still valid).
So what happens on a high volume neckline break down? A measured move below the neckline equal to the distance of the red arrow. There will be pauses along the way down like the 200day moving average and below that at the long term bullish trend line where bulls may defend vehemently - after all the stock is in a primary long term bull trend. But if it collapses, a completion of the measured move could take the stock all the way down towards the $35 area if shorts pile on and longs really get nervous about HOGs prospects in a slowing economy.
Something to consider if you are long or looking for a high probability technical setup for short exposure. Any other traders who are looking at this same setup and are playing it will use stops according to their risk tolerance...likely somewhere a little above the neckline.So what happens on a high volume neckline break down? A measured move below the neckline equal to the distance of the red arrow. There will be pauses along the way down like the 200day moving average and below that at the long term bullish trend line where bulls may defend vehemently - after all the stock is in a primary long term bull trend. But if it collapses, a completion of the measured move could take the stock all the way down towards the $35 area if shorts pile on and longs really get nervous about HOGs prospects in a slowing economy.
No comments:
Post a Comment