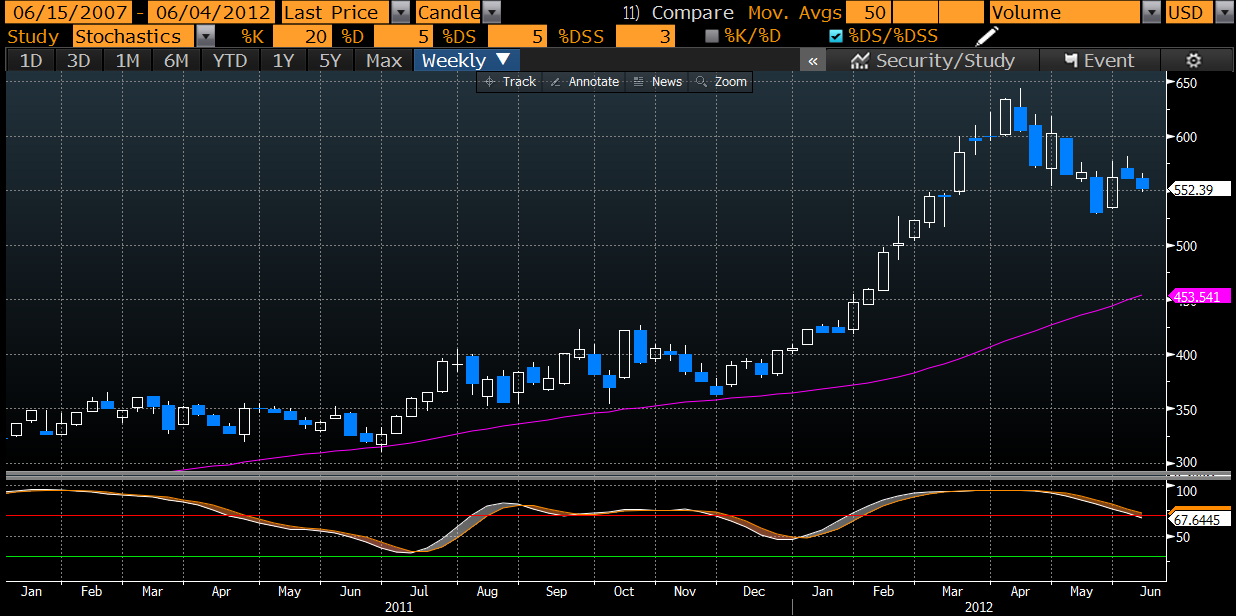
But although AAPL may have some bounce potential in the short term that traders can take advantage of, it has yet to put in a sustainable longer term bottom as shown in the weekly chart below from the beginning of 2011. As you can see from the oscillator on the lower portion of this chart there was a cross up in July 2011 2-3 weeks after the stock bottomed at its 50week moving average. Then again this past Dec/Jan there was a cross up from a higher level also shortly after the stock bounced off the same moving average. Currently the stock is still far away from its 50week moving average and the oscillator is descending - not even close to turning up.
Anyone looking to buy AAPL for a short term trade may do well if oversold conditions in the broad market as well as some single stocks reverse. But for anyone looking for a long term investment, it appears AAPL is not yet ready to resume its long term trend higher. When it is ready some signals, like a turn up from a lower level in the oscillator below, will give us a clue.
No comments:
Post a Comment